Expected Returns for Our Portfolio Companies
There's quite a bit of value - listing our best buys

With Q1 earnings season substantially in the books, it’s time to update the CAGR table following all post-earnings share price volatility.
In a nutshell, we believe our portfolio’s projected growth in underlying NOPAT is about to be 11-12% per annum. In Q1 2026, the growth rate was about 12% (constant-currency) and should be about 15% for FY26, potentially marking the third year in a row with double-digit growth (since starting the Substack). Our strategy is all about nimble companies with a scalable platform for growth, “silent” executives allocating capital very wisely, and below-average cyclicality in slowly changing industries allowing for strong IRRs on every investment initiative.
Coupled with a 30% ROIIC, it leaves us with a decent chunk of excess cash that will be returned to shareholders or could be reinvested into more growth opportunities versus what we’ve penciled in already. As you know, dividend taxes, dividend reinvestments, and buyback accretion are not reflected in the projected CAGR and we encourage every individual investor to reflect on these factors.
All in all, the solid growth and excess FCF translates into a 15% projected CAGR for the portfolio over the next decade (doubling every five years roughly). 85% of this CAGR should be driven our companies’ fundamentals - we’re not counting on a rerating in valuation to bail us out. If our portfolio’s performance will disappoint over the long run, it’ll be because of weak fundamentals (and that’s then 100% on us). One cannot and should not blame relative underperformance forever.
Given the dynamics on valuation and the reality that it takes time to compound growth and FCFs (leading to higher payouts to shareholders), one would expect returns to be back-loaded. That’s fine, and it also implies that any meaningful undervaluation today could be strongly reversed over time - just as long as our view on ROIIC, growth, capital allocation, growth runway… remains intact. In our Q1 letter, we put up a table showing how the excess FCF (after all growth initiatives) compares to the market caps at the end of March 2026. The numbers were staggeringly positive and point to yet another layer of margin of safety.
With that, let’s take a closer look at where the forward returns stand today. Interestingly, the attractiveness of the portfolio’s risk:reward has extended beyond more than a handful of names. What’s particularly worth mentioning is that, for some of our larger positions, the market’s growth expectations have been revised upward - for the first time in a while.
The Table
A general comment on the projected CAGRs is that, as a function of growth, ROIIC, growth runway, and our personal conviction, one could put in different multiples. We firmly believe that a 30% ROIIC portfolio with 11-12% annual growth should be trading at a premium to the market’s long-term average. This has been around 15-16x NOPAT for the S&P but there are limits to how much we’re wiling to pay up.
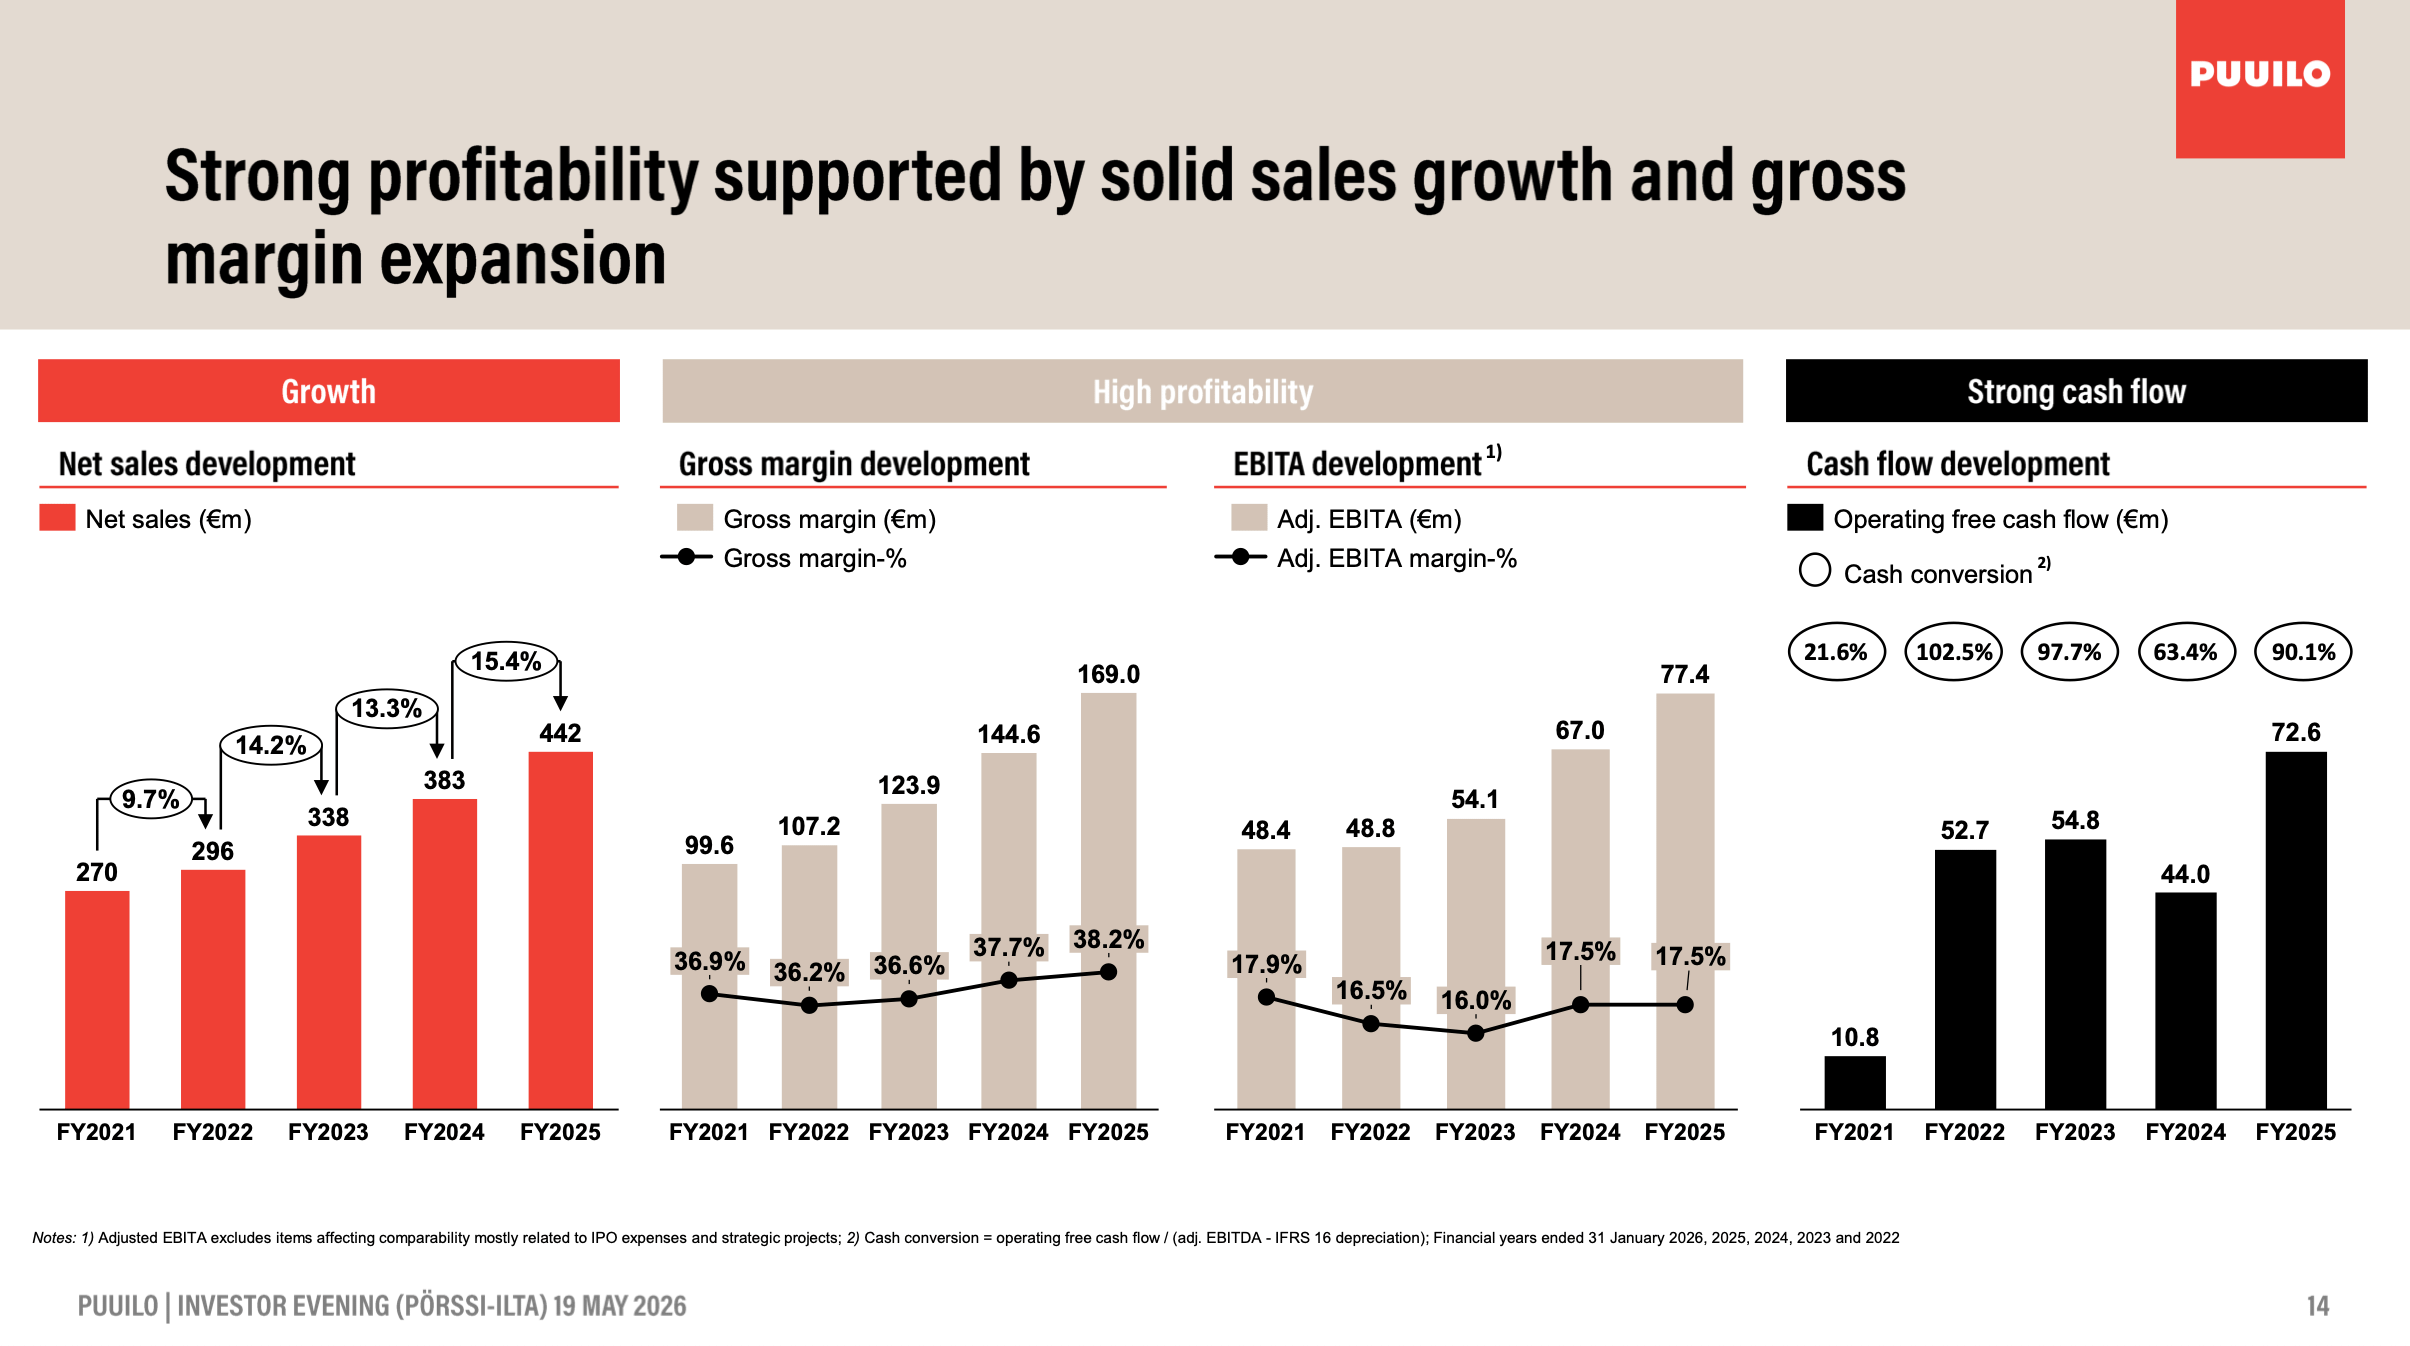
Backed by empirical evidence and irrespective of changing interest rates, we stand by a typical exit rate of 20-22x for most of our businesses. If the runway is more constraint (e.g., Puuilo focusing primarily on Finland now - but if they can expand successfully in Sweden, then it’s a different story), the multiple’s to be lower.