
Mastercard - Revisiting Our Initial Investment Case
Another new all-time high stock price

Introduction
Payment companies Visa and Mastercard need little introduction. Their business model reaps the fruit of a strong secular growth trend, namely the shift to electronic payments, as they act as the train track owners on which multi-trillion transactions run. They are the middleman between merchants and bank clients, providing services at a small cost of total transaction value which, in turn, enables them to hike their fees quite easily.
Whilst every business is at risk of becoming outdated by highly disruptive competitors, the onset of the post COVID-19 era has clearly shown the risks of investing in unprofitable payment companies. Therefore, we steadfastly believe prudent high-quality investors should stick to proven businesses such as V and in particular MA.
The largely fixed costs of running the payment network will allow MA to progressively grow its EBIT margin beyond the pre-COVID high of 57%, possibly to over 60% by the end of FY 2024. Thanks to a consistently elevated return on invested capital (ROIC) north of 60%, MA can continue to pursue strategic growth investments without giving up on its optimal shareholder-rewarding mix of share buybacks and rising dividend distributions.
MA’s runway for high-teens to low-twenties EPS growth over the medium term is achievable despite having lost the Russian business. Trading below its historical multiples, the stock should be considered attractive in today’s inflationary market environment.
Pivoting Toward Valued-Added Services
Although electronic payments have become mainstream in developed markets such as the US and Europe, over 80% of total worldwide payment transactions are still done in cash, creating ample growth opportunities for MA especially in mobile and commerce applications. Still, in FY '21 the US and Europe combined contributed 63% to MA's total gross dollar volume processed, totalling 4.87 trillion USD. Historically speaking, both regions have shown similar growth rates and are likely to continue to command the biggest chunk of MA's revenue distribution over the foreseeable future.

And whilst traditional payment transaction interference has been at the root of MA's great business performance over the past years, deepening its services portfolio such as value-added solutions, i.e., data analytics, and embracing new networks is a key priority for its management team. The below graphic gives an overview of what Mastercard's business model is all about, with core network activities forming the foundation through which additional value-added services and digital payments are facilitated.

MA generates revenues by routing a transaction to the issuer (the account holder's financial institution) for approval, enabling the exchange of financial information between the issuer and acquirer (the merchant's financial institution), and arranging transaction settlement through MA's chosen settlement financial institutions. MA switches transactions throughout the world whenever a MA account holder purchases goods or services from a merchant. If the merchant country differs from the country of issuance (switched cross-border transaction), more interference such as foreign currency translation is required resulting in additional revenue streams for MA.
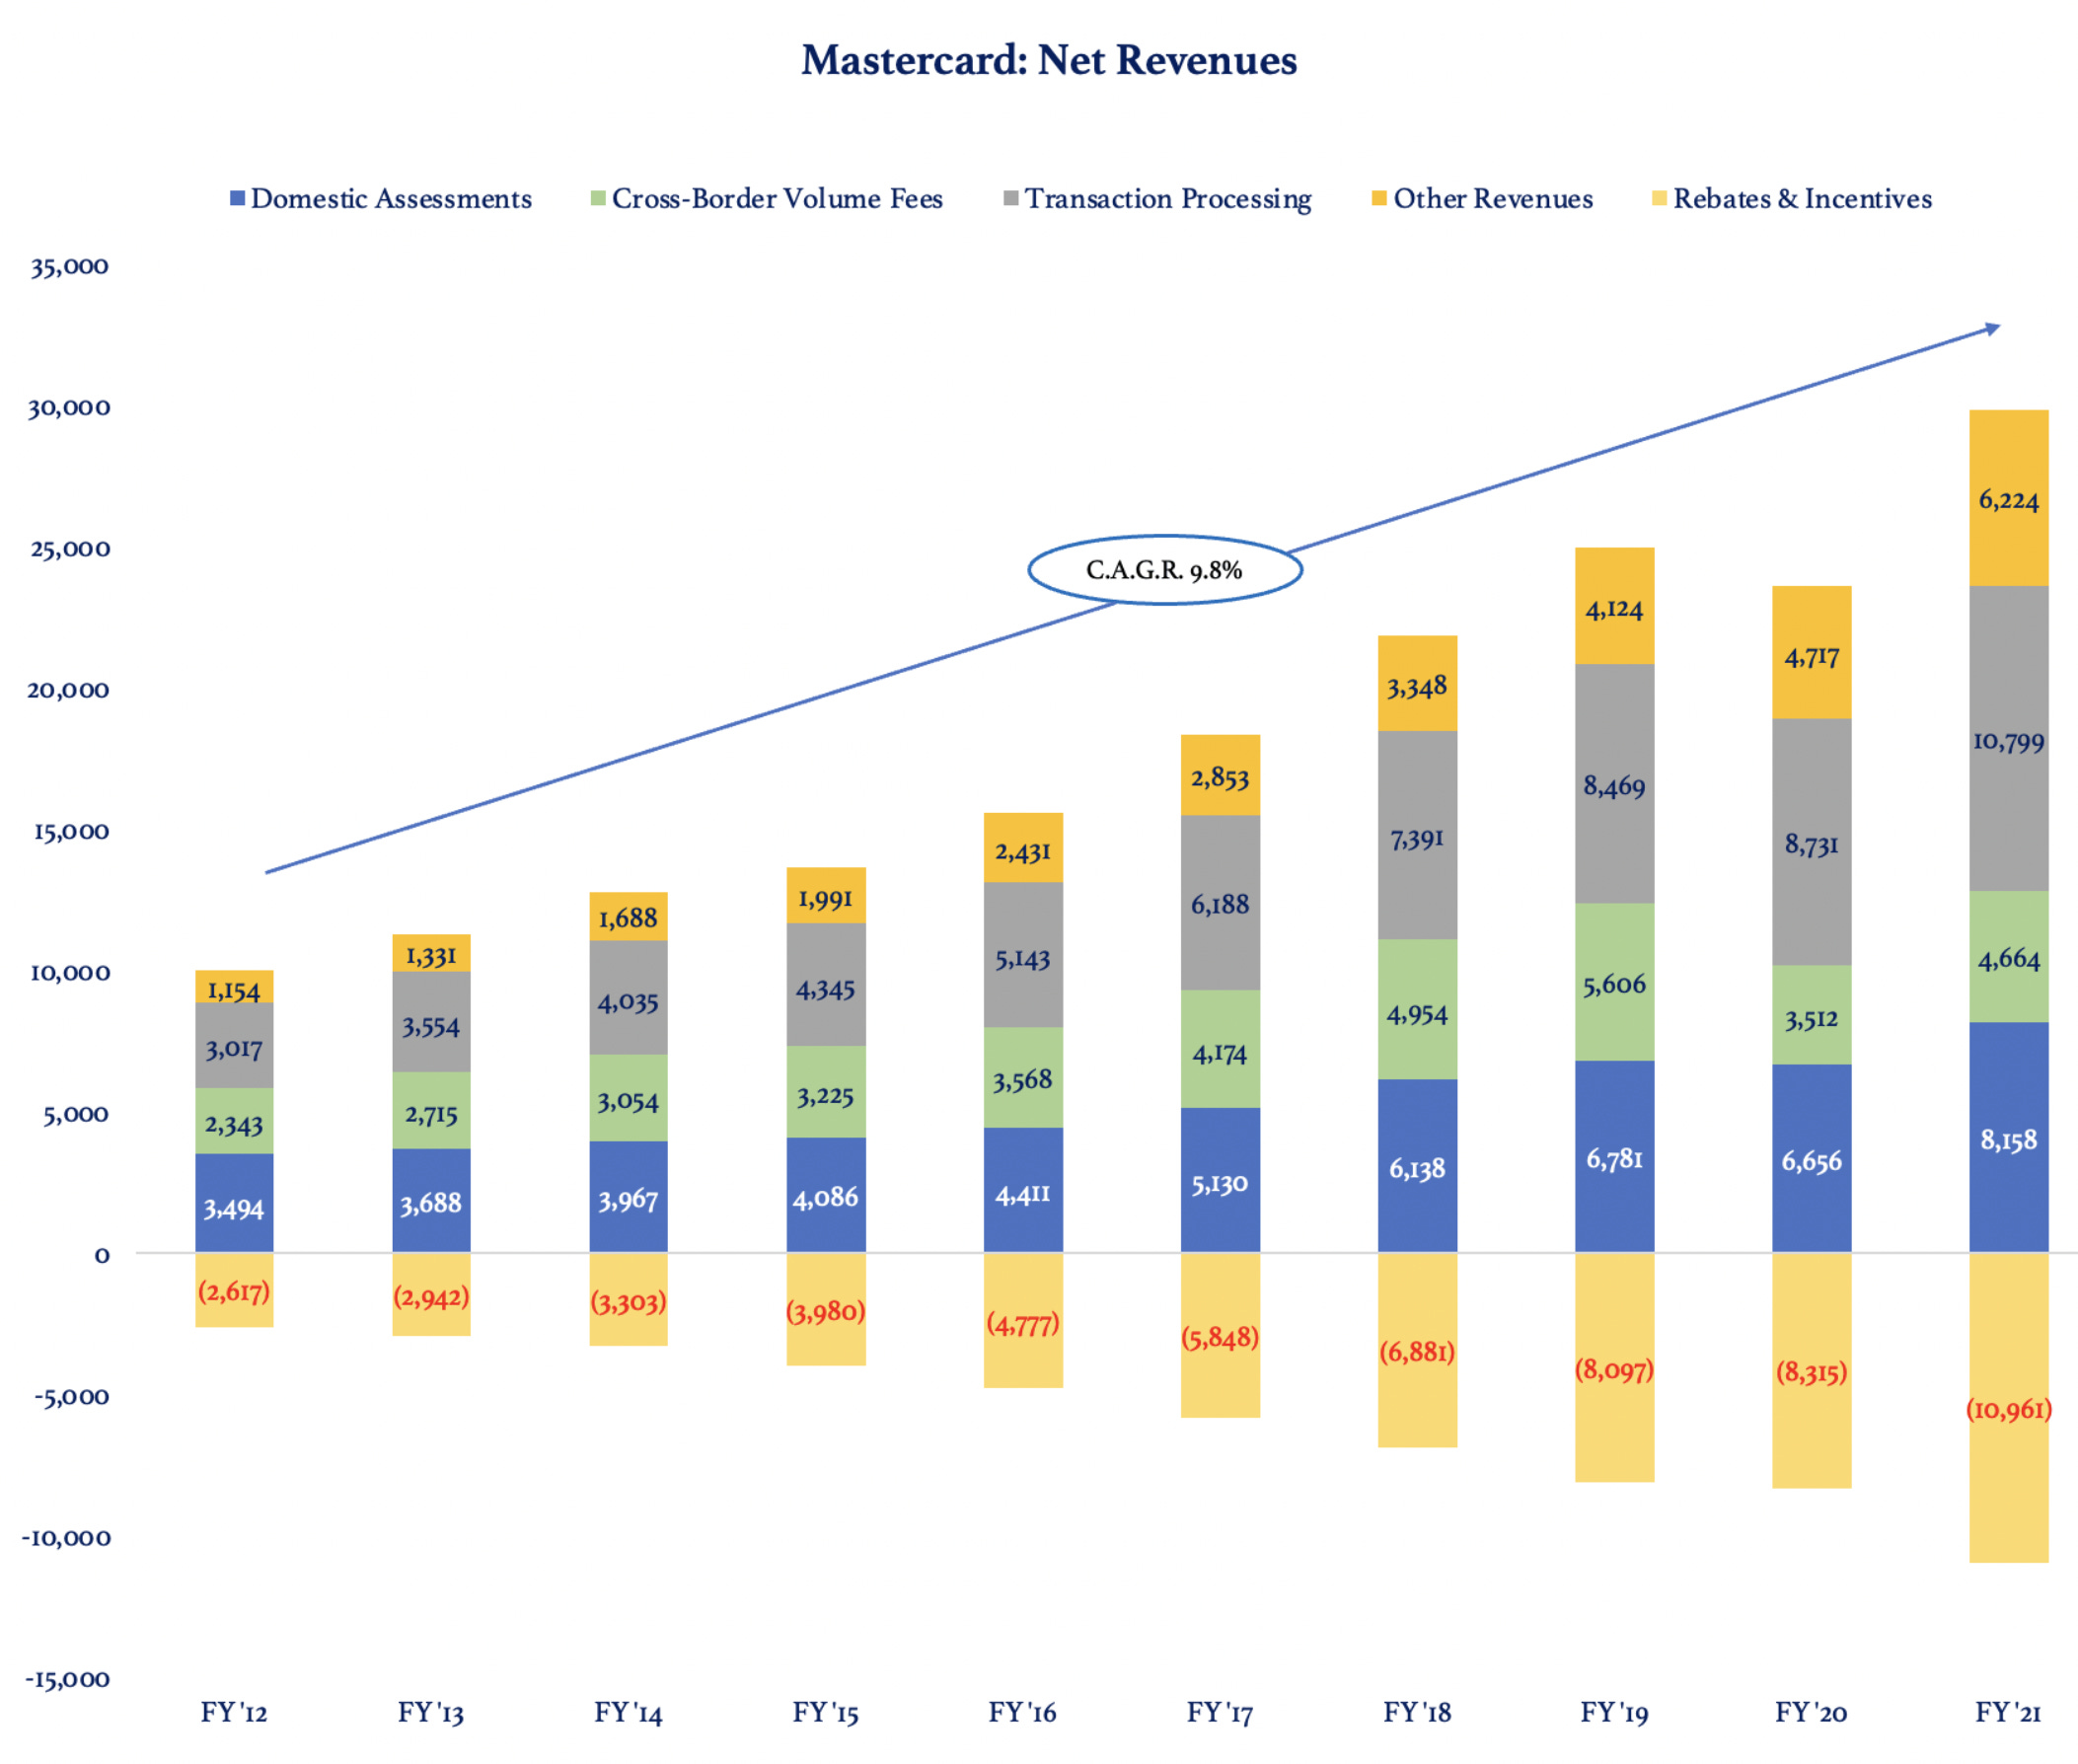
Notwithstanding recent expansion into purely recurring value-added services such as intelligence solutions, MA's net revenue growth is closely tied to transaction frequency and transaction volume, the latter for which inflationary pressures are a positive. The benefit from regularly hiking fees has been partly offset by growing contra-revenues to incentivize contracts for achieving specific milestones. The below graphs illustrate the correlation between the change in payment volumes and MA's top line.

Excellent Track Record Only Briefly Interrupted By Severe COVID-Restrictions
As can be noticed from the below pie graph, MA's "Other revenues" encompassing cybersecurity, fraud detection, data analytics etc. have grown at a faster clip than the other segments since FY '12 (18.4% per annum versus annual net revenue growth of 9.8%). These subscription-linked and thus recurring income streams accounted for approximately 21% of total gross revenues in FY '21.
On top of that, roughly 5% of transaction processing revenues was actually being categorized under services revenues, bringing the total contribution to 22.5% of gross revenues in FY '21. After deducting the rebates and incentives, their net revenue weight is currently at the high-end of high thirties percentage.
Obviously, we'd better not lose sight of the impact the pandemic had on MA's highly lucrative cross-border business, as this segment's contribution has dropped from 23% in FY '12 to 16% in FY '21. Having said that, further monetizing on alternative revenue sources will make MA's cash flows less prone to economic downturns and should warrant a higher valuation multiple. In recent years, MA has been successful at differentiating its services to create a stickier ecosystem that will cement its industry-leading ROIC and cash flow growth ambitions.


As explained above, sustainable growth in cross-border volume transactions is explanatory to MA's elevated profit margins. In most of the pre-COVID years, Cross Border growth exceeded growth in domestic assessments and overall transaction processing. The post-COVID recovery in travel should continue, albeit at a slower pace than during most of FY '21, representing a key tailwind to MA's revenue growth. With Asia-Pacific lagging behind other regions, APMEA could viewed as a longer-term wild card for MA's revenue growth once local authorities start lifting COVID restrictions.

The shift toward electronic payments accelerated noticeably in FY '20 but could not compensate for the 29% drop in total cross-border volume, with the cross-border excluding intra-Europe performing even worse. It's only during the fourth quarter of FY '21 that the latter exceeded the levels last seen in 2019. Fortunately, a growing portion of revenues coming from value-added services (enabling MA's connected financial institutions and merchants to benefit more from their partnership) mitigated the decline in overall net revenues in FY '20. Still, operational revenue growth was -9%, while adverse FX translation and positive M&A contribution balanced each other out.

One of the main reasons to like MA's business model is the large portion of fixed costs for running its global network, which allows for sustainable long-term margin expansion. Due to negative top line growth in FY '20 and a change in mix, MA's recurring EBIT margin shrunk as administrative expenses rose slightly compared FY '19, attributable to increased investments in core strategic initiatives and completed M&A deals.
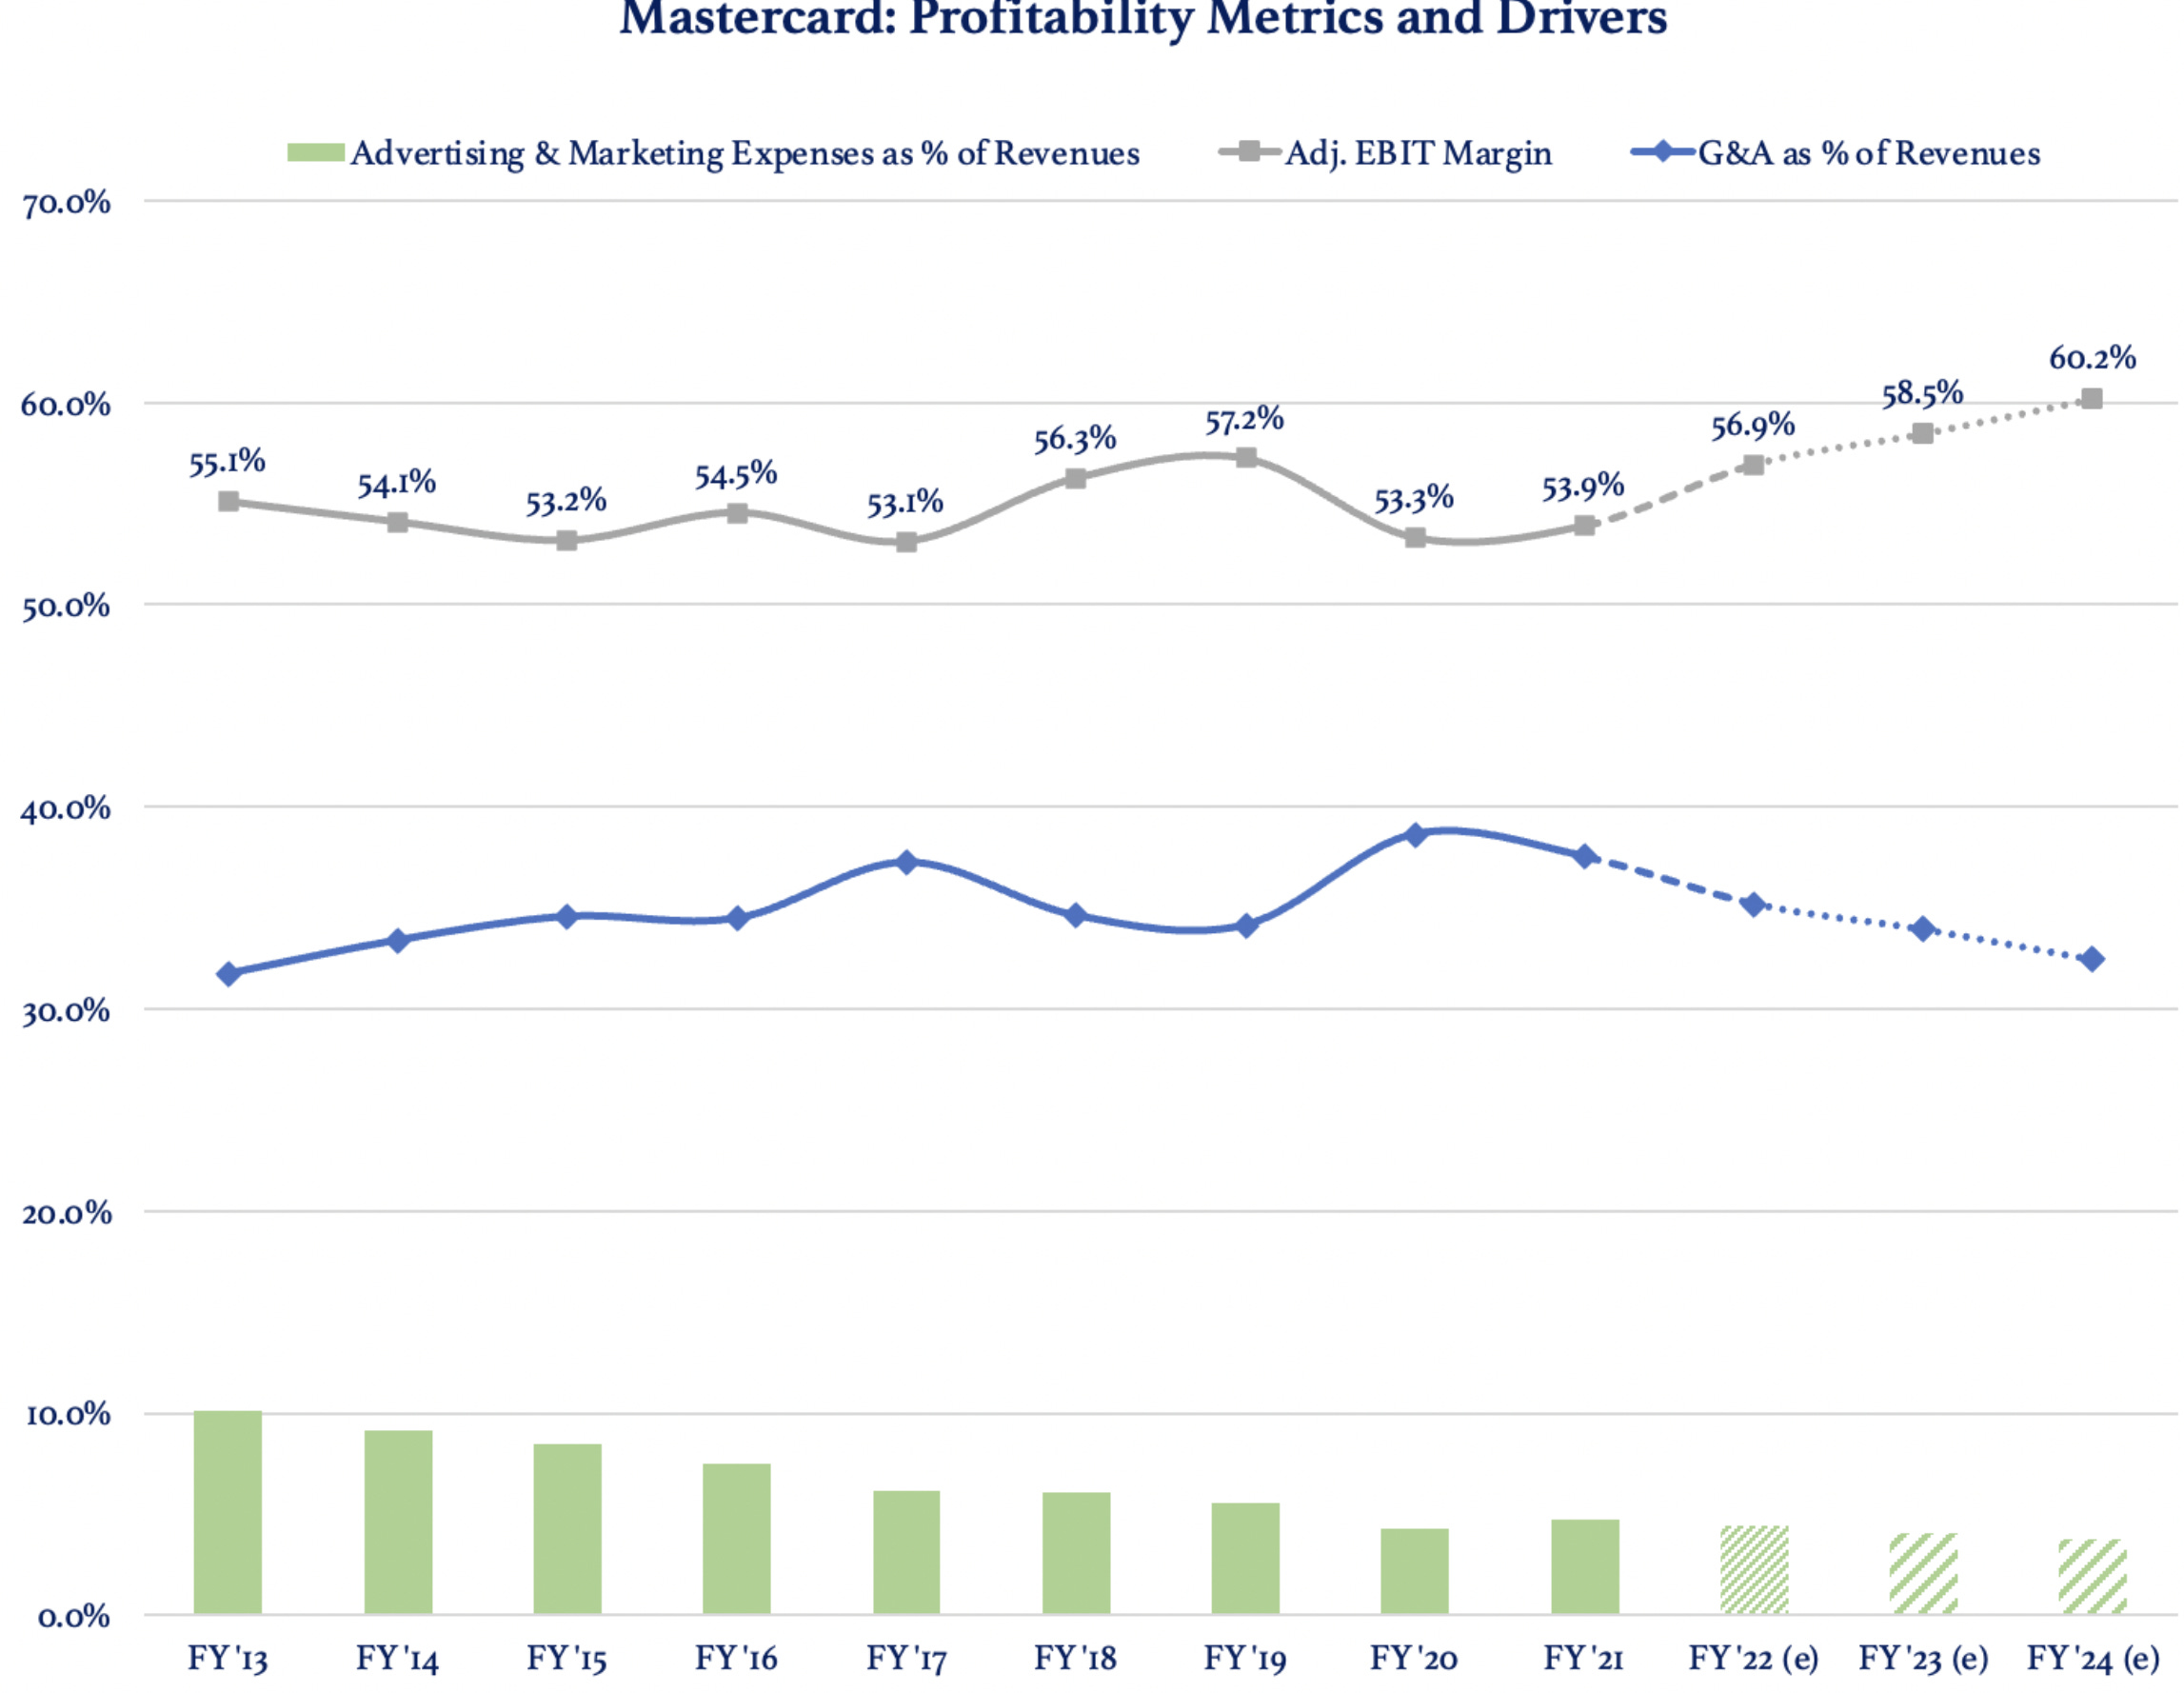
In FY '21, top line benefited from a broad-based recovery in payment volumes, eking out 20% operational growth at constant currency. However, with cross-border volume (excluding intra-Europe) still well below 2019 levels for the most part of 2021, MA's adjusted EBIT margin barely improved (60 bps).
Strong Start to The Year Despite Business Suspension in Russia
The Omicron variant had a relatively short-lived impact on MA's business, as it did not materially hinder the recovery in cross-border volume throughout Q1 2022. The year-over-year improvement came in at 53%, resulting in MA posting four consecutive quarters of more than 50% growth in this high-margin segment.

As a percentage of the respective period in 2019, cross-border excluding intra-Europe stood at 115%, which marked a strong improvement from Q4's 98%. Throughout March 2022, cross-border travel had managed to exceed 2019 levels by 5% for the first time since the pandemic began. This trend gained further traction in April with total XB travel volume being 110% of MA's 2019 level.

Following the invasion in Ukraine and along with other payment companies, MA announced on March 5 that it would cease business operations in Russia, which until then contributed 4% to MA's total net revenues and represented one of its best markets (fast-growing region with attractive long-term prospects for value-added services, increased cross-border activity and additional payment flows such as disbursements).
During the Q1 2022 earnings conference call, management didn't negatively revise its revenue and profit growth targets for FY '22 despite having lost its foothold in Russia. In the first quarter of 2022, a one-off expense benefit related to the termination of a Russian consumer incentive program ($30M) made up for the lost revenues ($34M). While the Russian business suspension will for sure present a headwind to MA's mid-term growth targets, a stronger-than-anticipated recovery in travel and consumer spending is expected to neutralize these negative effects in FY '22.
Aside from guiding for a larger-than-expected currency headwind during fiscal 2022, the outlook for non-GAAP revenue growth remained unchanged, while growth in operating expenses should land in the high-single digits versus low end of low-double digits previously. This, in turn, indicates that MA's management team is calling for approximately 22% EBIT growth in both Q2 2022 and FY 2022. Including the positive effect from the ongoing share repurchase program, we expect MA to show 24% year-over-year adjusted EPS growth in Q2 2022, as the basis for comparison starts to normalize because of subsiding COVID-19 headwinds.

Industry-Leading ROIC Results in Accelerated FCF per Share Growth
Although MA has been boosting strategic investments through organic CapEx and M&A since FY '19, its rock-solid Return On Invested Capital has been barely affected. Given that MA's management team will power ahead with service development, temporarily higher SG&A expenses and strategic investments are eventually going to result in over 62% EBIT margin, similar to the kind of profitability Visa achieves nowadays.
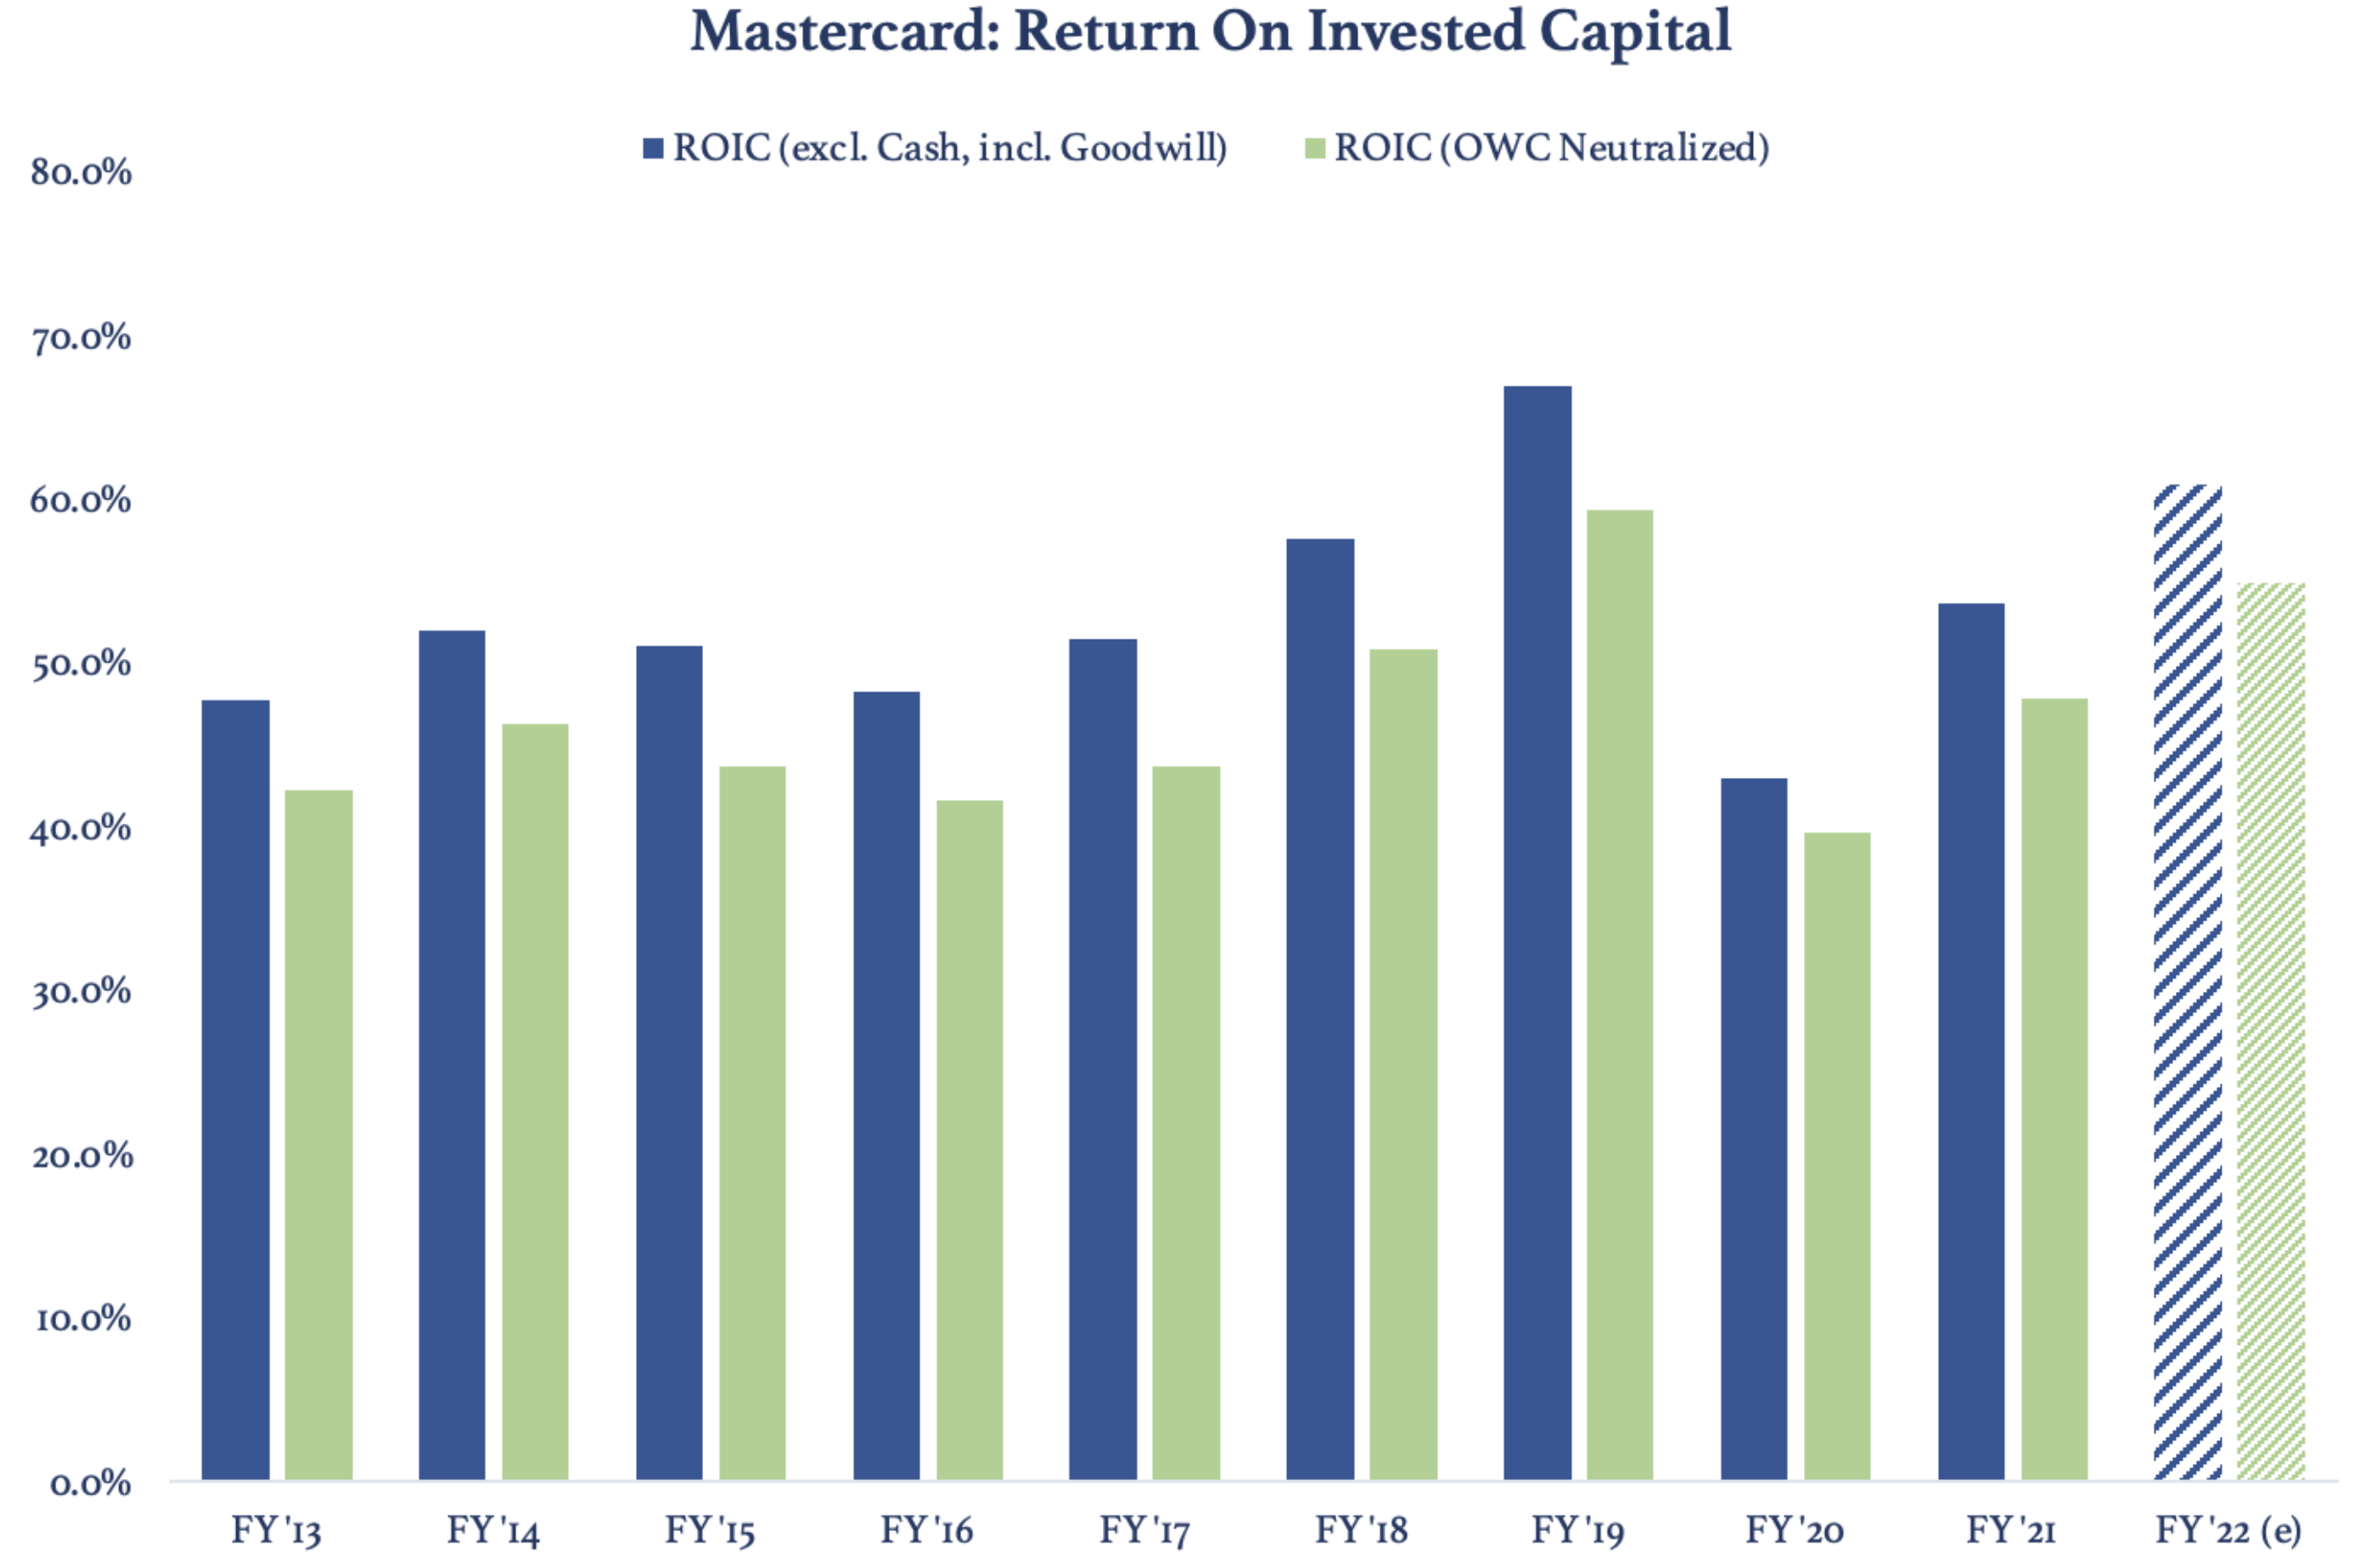
Combined with its materially better growth prospects (>20% annual growth in service revenues versus Visa's >10% target) and industry-leading return on capital, investors are somewhat underestimating MA's long-term investment case. Thanks to proven strategy execution and a clear playbook for growth in services and new networks such as remittances and disbursements, MA is capable of delivering annual adjusted free cash flow per share growth of 18% to 20% for the biennium 2023-2024, in line with the 19% CAGR it had achieved during pre-COVID 2013-2019.

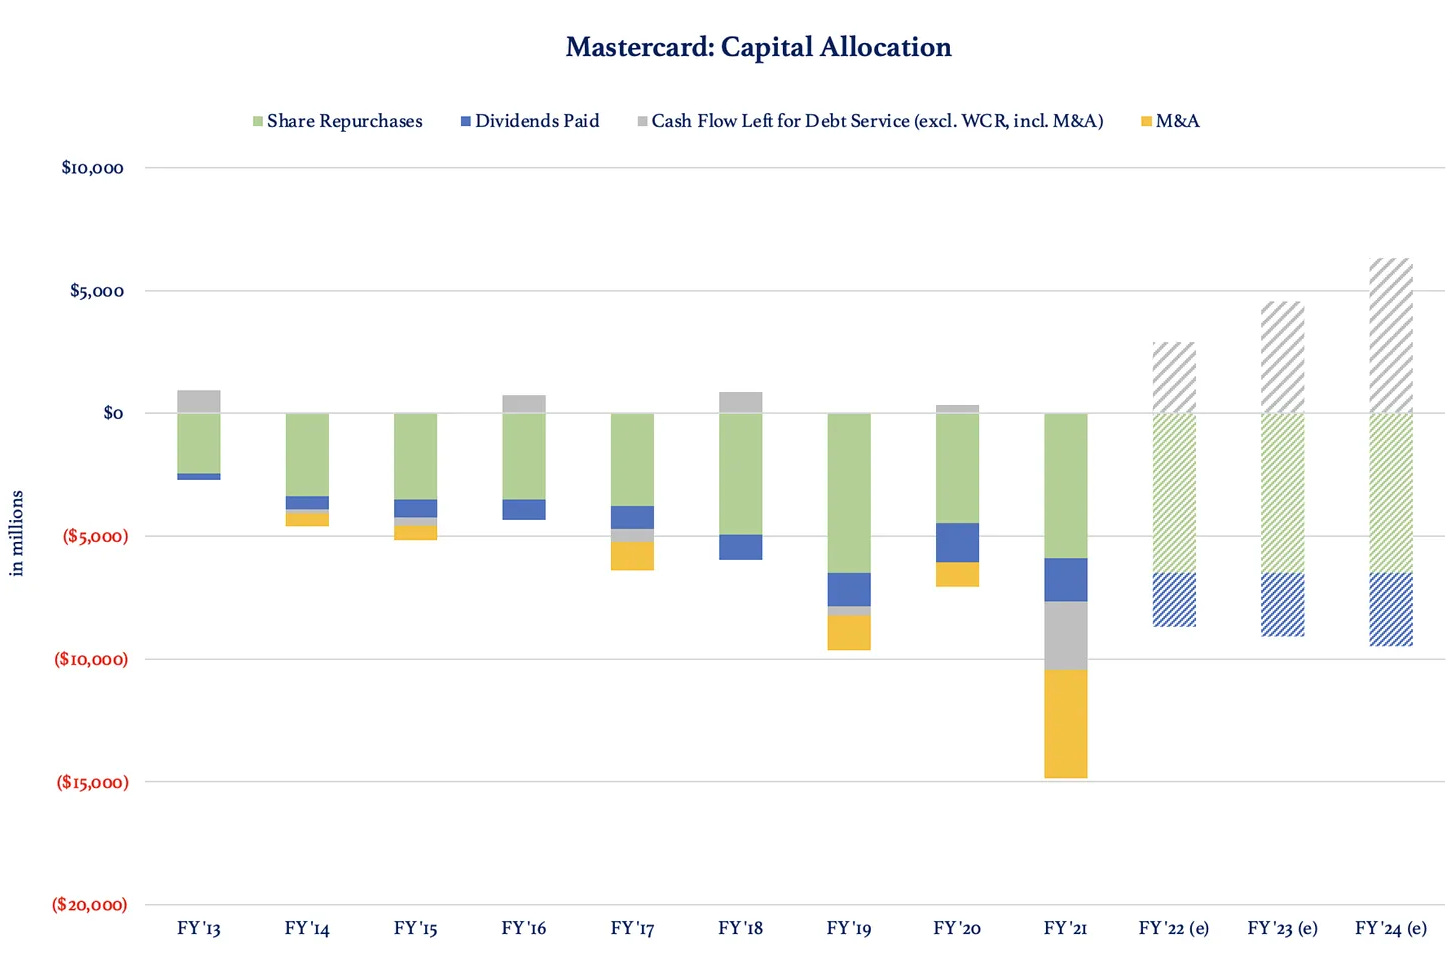
We explicitly did not factor in any positive contribution stemming from bolt-on M&A. The below graph depicts MA's capital allocation decisions, out of which expected cumulative cash available for debt service over 2023-2024 represents $10.8B, thereby turning today's net debt position into a cash pile of $7.7B by the end of fiscal 2024.
Zigzagging Share Price Has Pushed Valuation Down
A widespread growth scare, inflationary headwinds that could linger for several quarters or even years, and rising interest rates have pushed MA's valuation multiples down to below-average levels. For FY '23, MA's historical earnings yield of 3.3% translates into 17% upside from current prices. Moreover, today's price action implies MA's free cash flow yield reaching 5.1% by FY '24, which looks quite attractive to us given MA's highly cash-generative business model, wide moat and well-balanced growth strategy. Even if sustained multiple contraction were to take hold, longer-term annual returns could still land in the low-teens.

Risks
The main risk to an investment in MA is determining the impact of a looming recession on its business revenue. Whilst inflation has been a net-net positive for this card network company, falling payment volume as a result of reduced consumer spending volume could materially hurt its net revenue. Fortunately, MA has successfully pivoted into other revenue streams such as services and subscription-based B2B payment solutions, thereby lowering the dominance of non-recurring income which closely tracks the evolution in total gross dollar volume.
The introduction of a new payment network or disruption of existing platforms may pose a substantial threat to MA. In order for these new initiatives to be successful, they should be very convenient for merchants and issuing financial institutions while at the same time offering a competitive fee rate. Also, MA and V haven proven to capture the benefits from new technologies such as BNPL and digital wallets, effectively turning threats into multi-billion dollar opportunities.
While we do acknowledge the powerful existence of fintechs, their cost of capital has skyrocketed in wake of the COVID-19 revaluation trade and spiraling inflation expectations. Consequently, most of them will turn out to be dire failures due to their poor economics and lack of scale.
Concluding Remarks
Although electronic payments have become mainstream in developed markets such as the US and Europe, over 80% of total worldwide payment transactions are still done in cash, creating ample growth opportunities for MA especially in mobile and commerce applications.
Although MA has been boosting strategic investments through organic CapEx and M&A since FY '19, its rock-solid Return On Invested Capital has been barely affected. Combined with its materially better growth prospects (>20% annual growth in service revenues versus Visa's >10% target) and industry-leading return on capital, investors are somewhat underestimating MA's long-term investment case.
The main risk to an investment in MA is determining the impact of a looming recession on its business revenue. Whilst inflation has been a net-net positive for this card network company, falling payment volume could materially hurt its net revenue. Fortunately, MA has successfully pivoted into other revenue streams such as services and subscription-based B2B payment solutions, thereby lowering the dominance of non-recurring income which closely tracks the evolution in total gross dollar volume.
For FY ‘23, MA's historical earnings yield of 3.3% translates into 17% upside from current prices. Moreover, today's price action implies MA's free cash flow yield reaching 5.1% by FY '24, which looks quite attractive to us given MA's highly cash-generative business model, wide moat and well-balanced growth strategy.
Recent Earnings Report
Now, what’s our take on MA’s recent earnings report, outlook and valuation?