
Deep Dive - O'Reilly Automotive
Becoming the dominant US auto parts retailer in DIY and DIFM

Following our March 2024 deep dive on AutoZone (AZO), we’ll now be digging deeper into O’Reilly Automotive (ORLY).

In the AZO write-up, we’ve already provided color on how one of the leading US auto parts retailers operates, including:
demand dynamics in the automotive aftermarket;
recent financial performance, including AZO’s LIFO accounting headwinds in its FY2022 and FY2023;
economics of AZO’s business (and why one should never look at reported ROIC to gauge the return on incremental investment decisions);
international expansion opportunities;
buyback optionality relative to our base IRR;
Now, we’ll complement the AutoZone deep dive with additional background on ORLY’s track record, capital allocation priorities, importance of management and highly motivated and trained professional parts people, and other qualitative aspects that have led to its to-date triumphs.
Additionally, we’ll go over the competitive landscape, i.e. peers’ recent financial performance, cover the differences between AZO, ORLY and AAP (Advance Auto Parts), and the impact of technological advancements on demand for auto parts.
The deep dive will cover:
Part I - Industry Drivers & Barriers to Entry
Part II - Competitive Landscape: ORLY vs. AZO vs. AAP
Part III - ORLY’s Long-Term Track Record
Part IV - Recent Financial Performance
Part V - Management & Expectations Treadmill
Part VI - Valuation
Part VII - Risks & Uncertainties
Part VIII - Conclusion
Part I - Industry Drivers & Barriers to Entry
Let’s kick off the discussion with the overall industry drivers and barriers to entry/competitive advantages for the leading players.
Miles Driven and Supply of Cars
Miles driven, the supply of new car sales, used car sales, average vehicle age: they all impact the long-term growth picture for ORLY’s sector, and they’re exposed to macro events.
When looking at the automotive aftermarket industry, it has faced short-term shocks before, but it's always rebounded. As miles driven return, so does the industry. The current outlook is supported by a strong trend in miles driven, solid employment conditions, and overall population growth.
AutoZone’s former chief exec, Bill Rhodes, said it well in May 2022:
If you think about the – over the last 30 years, there is been four significant shocks to the economy. In all four of those shocks, our performance and our industry’s performance has made a meaningful step up during those shocks, recessions and pandemics that our business has gone up, and it’s never stepped back down. And I don’t understand why, when we have a recession, our business goes up and we come out of it and our business never goes down. It seems to flat line and then grow from there. It’s amazing to me. As rising raw material pricing, labor and transportation costs are all impacting us and our suppliers, inflation has been prevalent in the aftermarket space. We have no way to say how long this will last, but our industry has been disciplined about pricing for decades, and we expect that to continue. It is also notable that following periods of higher inflation, our industry has historically not reduced pricing to reflect lower ultimate cost.
Exhibit I - O’Reilly
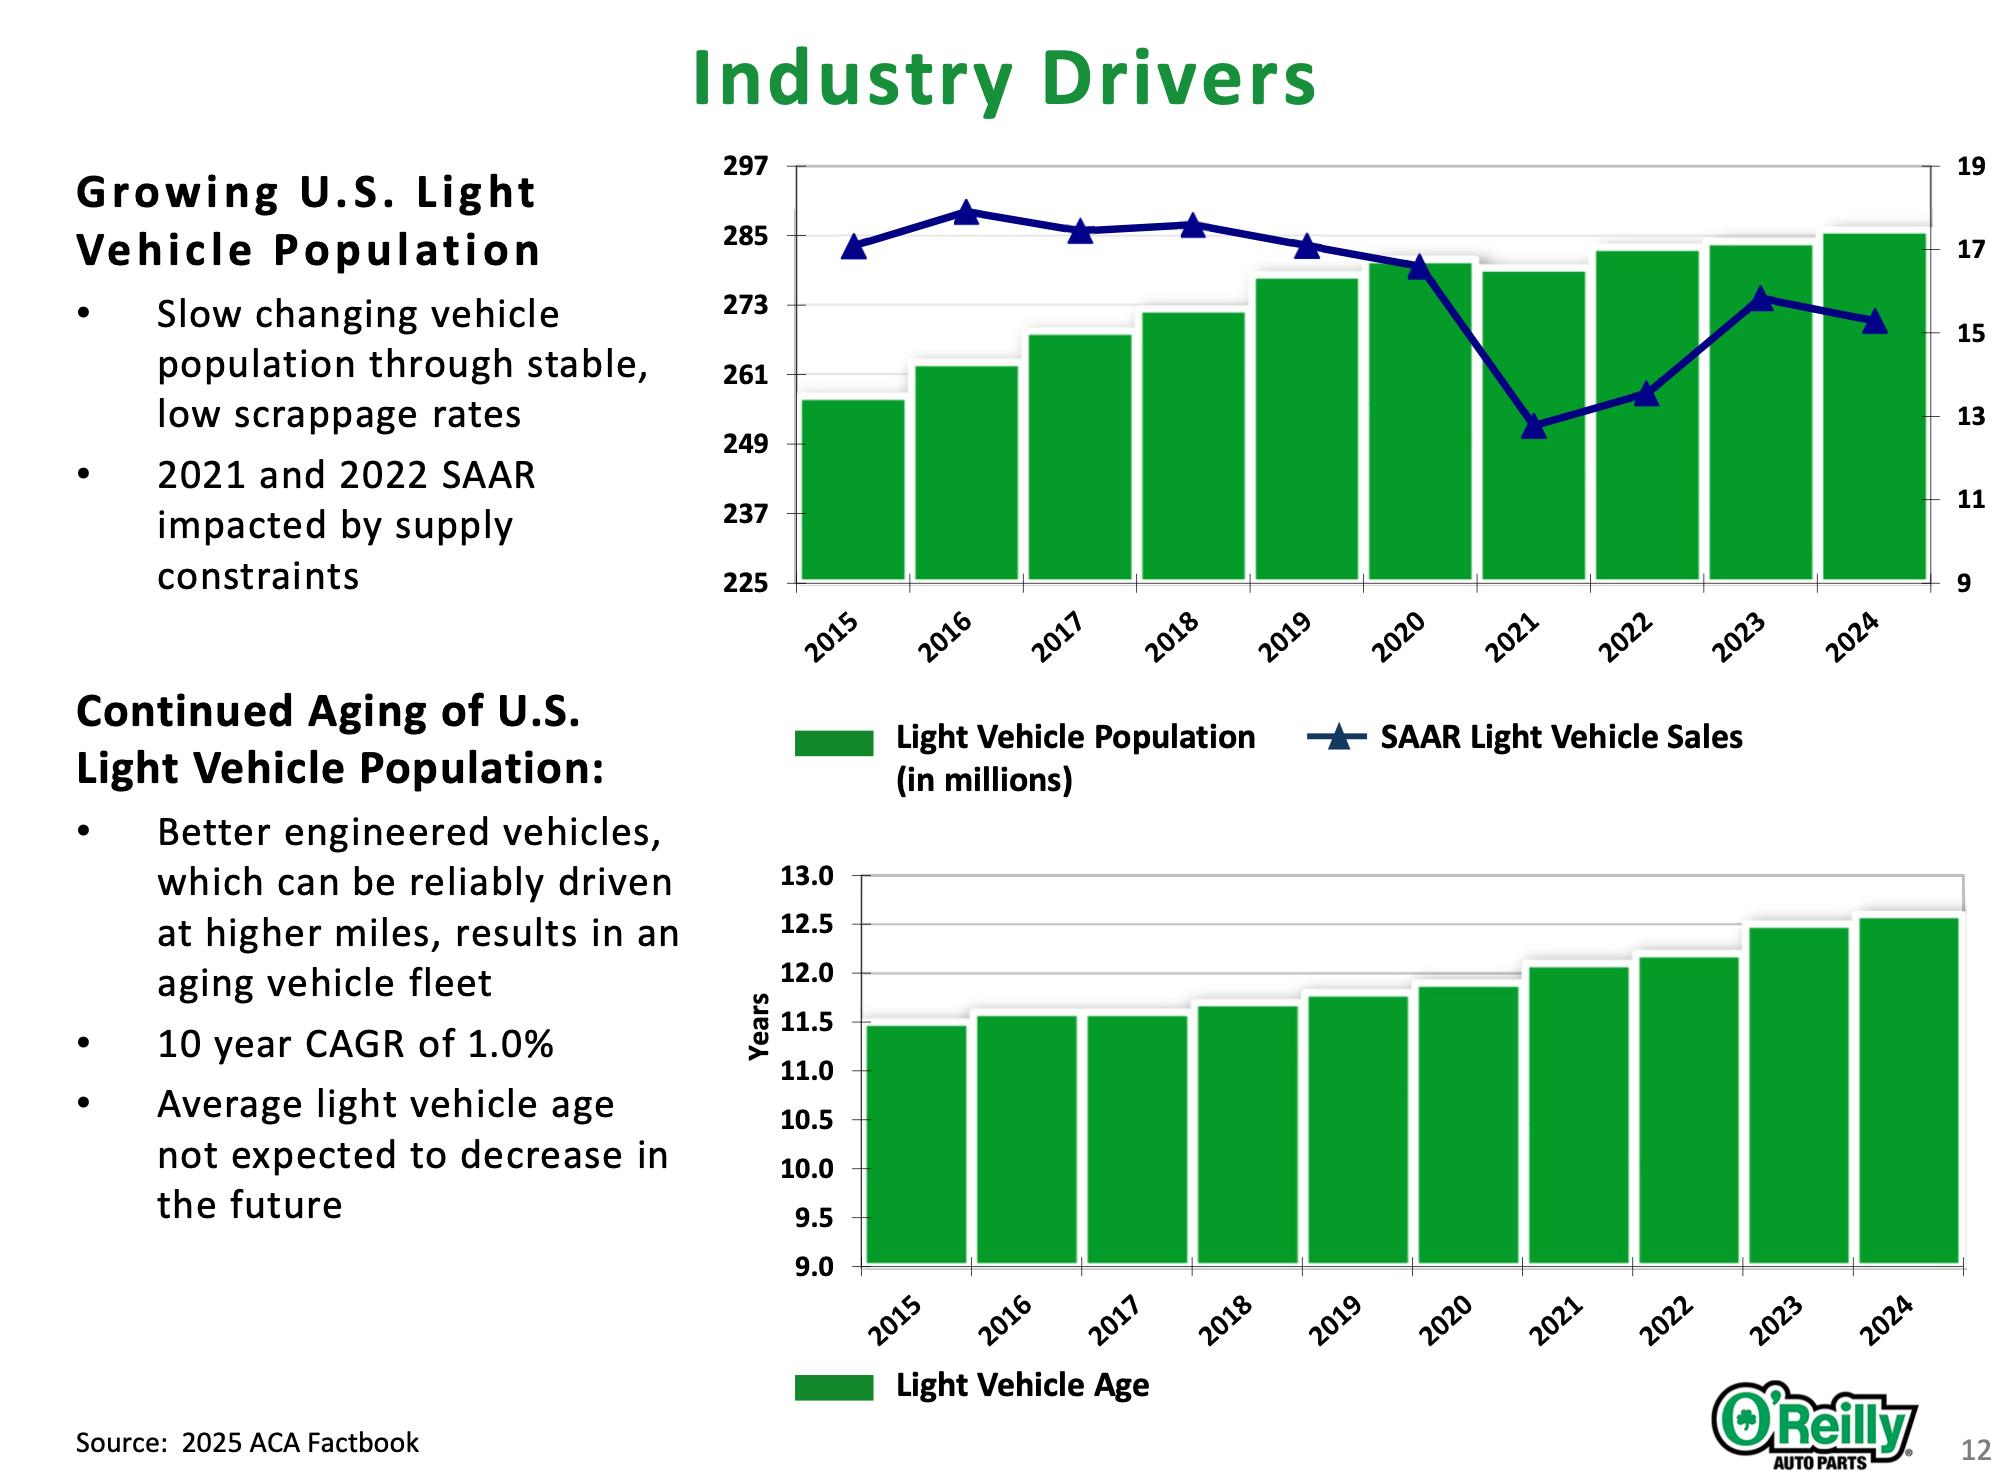
Exhibit I highlights that there was a significant reduction on the number of light vehicle sales in 2021 and 2022 (due to supply chain disruptions), which could impact the growth of the automotive aftermarket in FY27 - FY30.
However, as that average vehicle age has increased and not just increased but the reliability of vehicles allowing people to invest and to get good value out of their vehicle much later in the life means more miles are being driven over a much broader and extended period of vehicle lives. As such, it mitigates the impact of any one or two years' worth of cohorts with weaker vehicle sales.
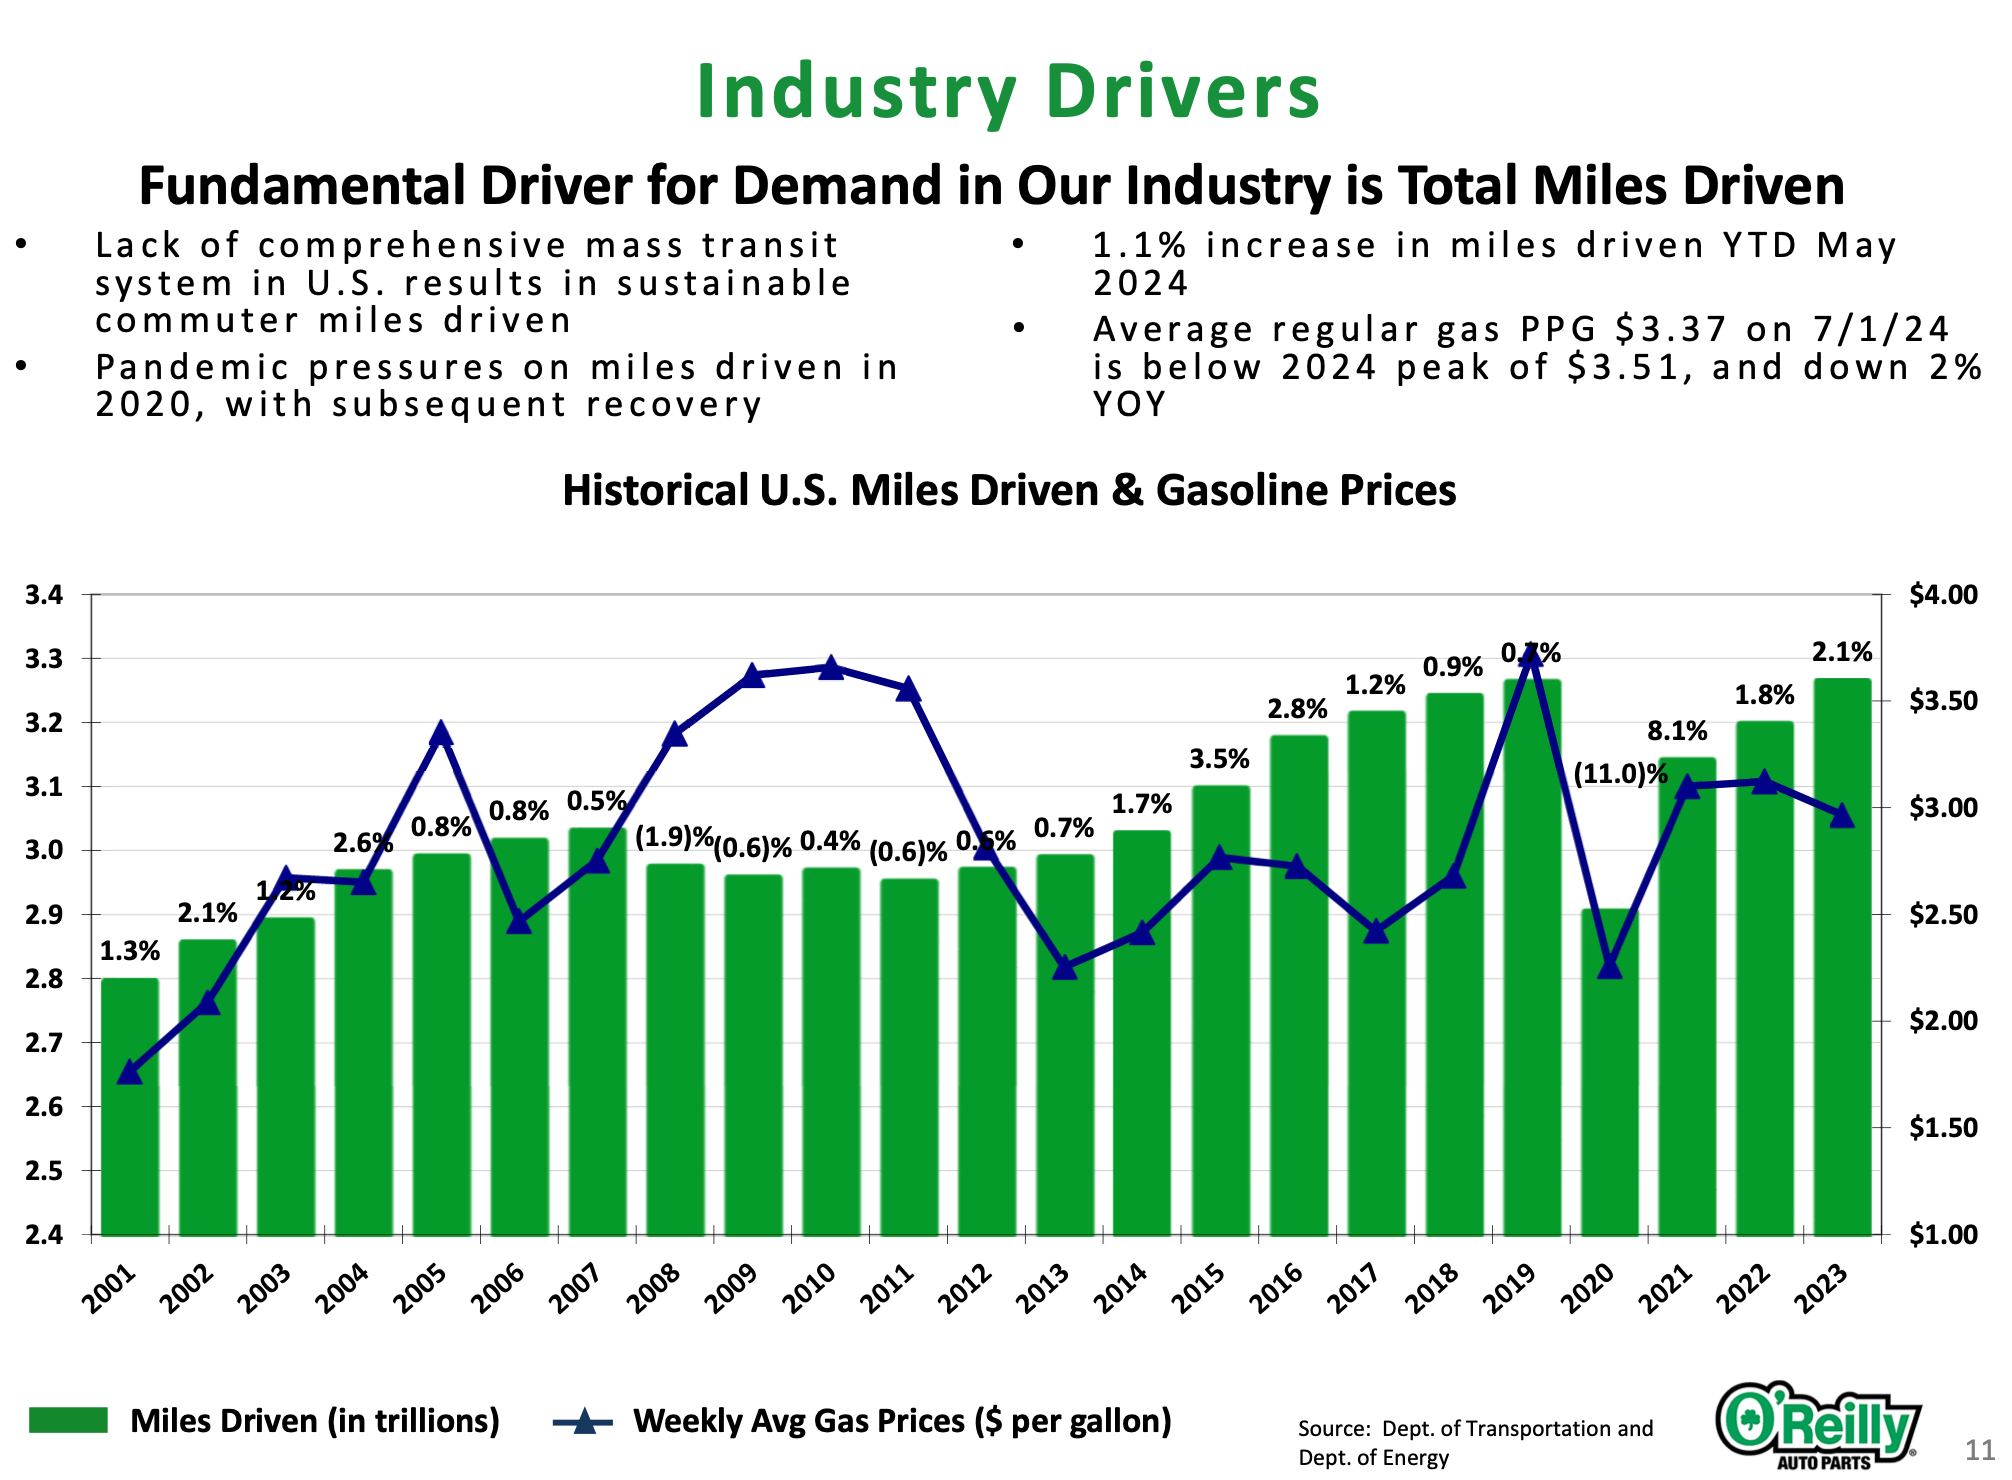
Exhibit II - O’Reilly
E-Commerce & Inventory Availability
The automotive aftermarket has traditionally been, and continues to be, a predominantly physical industry, similar to the home improvement sector. While customers can browse ORLY’s website for information and make purchases for in-store pickup, the service component remains absent, which is why even the mobile apps for ORLY (and AZO) don't offer a significant advantage beyond perks and loyalty programs.
Several factors suggest that the physical aspect of the industry is likely to remain vital for the foreseeable future.
Inventory Availability & Service: ORLY maintains detailed records of car registrations and models, enabling them to assist customers quickly and efficiently. The expertise of their professional parts staff is one of ORLY’s most valuable assets, allowing them to justify a markup on their parts by providing unmatched support and knowledge. Additionally, customers who want to complete small DIY jobs at home without purchasing expensive tools can rent them by putting down a deposit at their local ORLY store. This personalized service, combined with highly experienced and motivated employees, is key to ORLY’s success.
Moreover, 95% of ORLY’s stores receive intraday service from either a servicing hub store or a distribution center (DC) city counter, with multiple runs each day. This ensures that customers receive the parts they need promptly, allowing them to get their vehicles back on the road without delay. On average, a DC serves about 250 stores with five-night-per-week delivery, making ORLY the only company in its industry to offer such consistent service across every location. Additionally, all of ORLY’s distribution nodes have reverse logistics capabilities, enabling the company to effectively manage the product life cycle by adjusting inventory levels as demand changes.
For discretionary items like car mats or engine coolant, which require little after-sale support, customers can easily order online from retailers like Amazon or Walmart. However, when it comes to inventory availability, ORLY’s ability to manage the product life cycle is one of its most complex and valuable competitive advantages. Keeping inventory and payables cash flow healthy is crucial (more on that later).
Everything begins with late-model coverage. As vehicles exit their warranty periods and parts start to fail, having the right parts available when customers need them is critical. ORLY excels at managing this process, ensuring that parts for late-model vehicles reach their stores in time. They rely on demand signals from stores, customers, and suppliers to ensure they stock the parts just as they begin to fail in the market, ensuring customers find the solutions they need when they visit an ORLY store.
If the part isn’t available, it’s unlikely the customer will return. Thus, building long-term relationships that lead to repeat business is paramount.
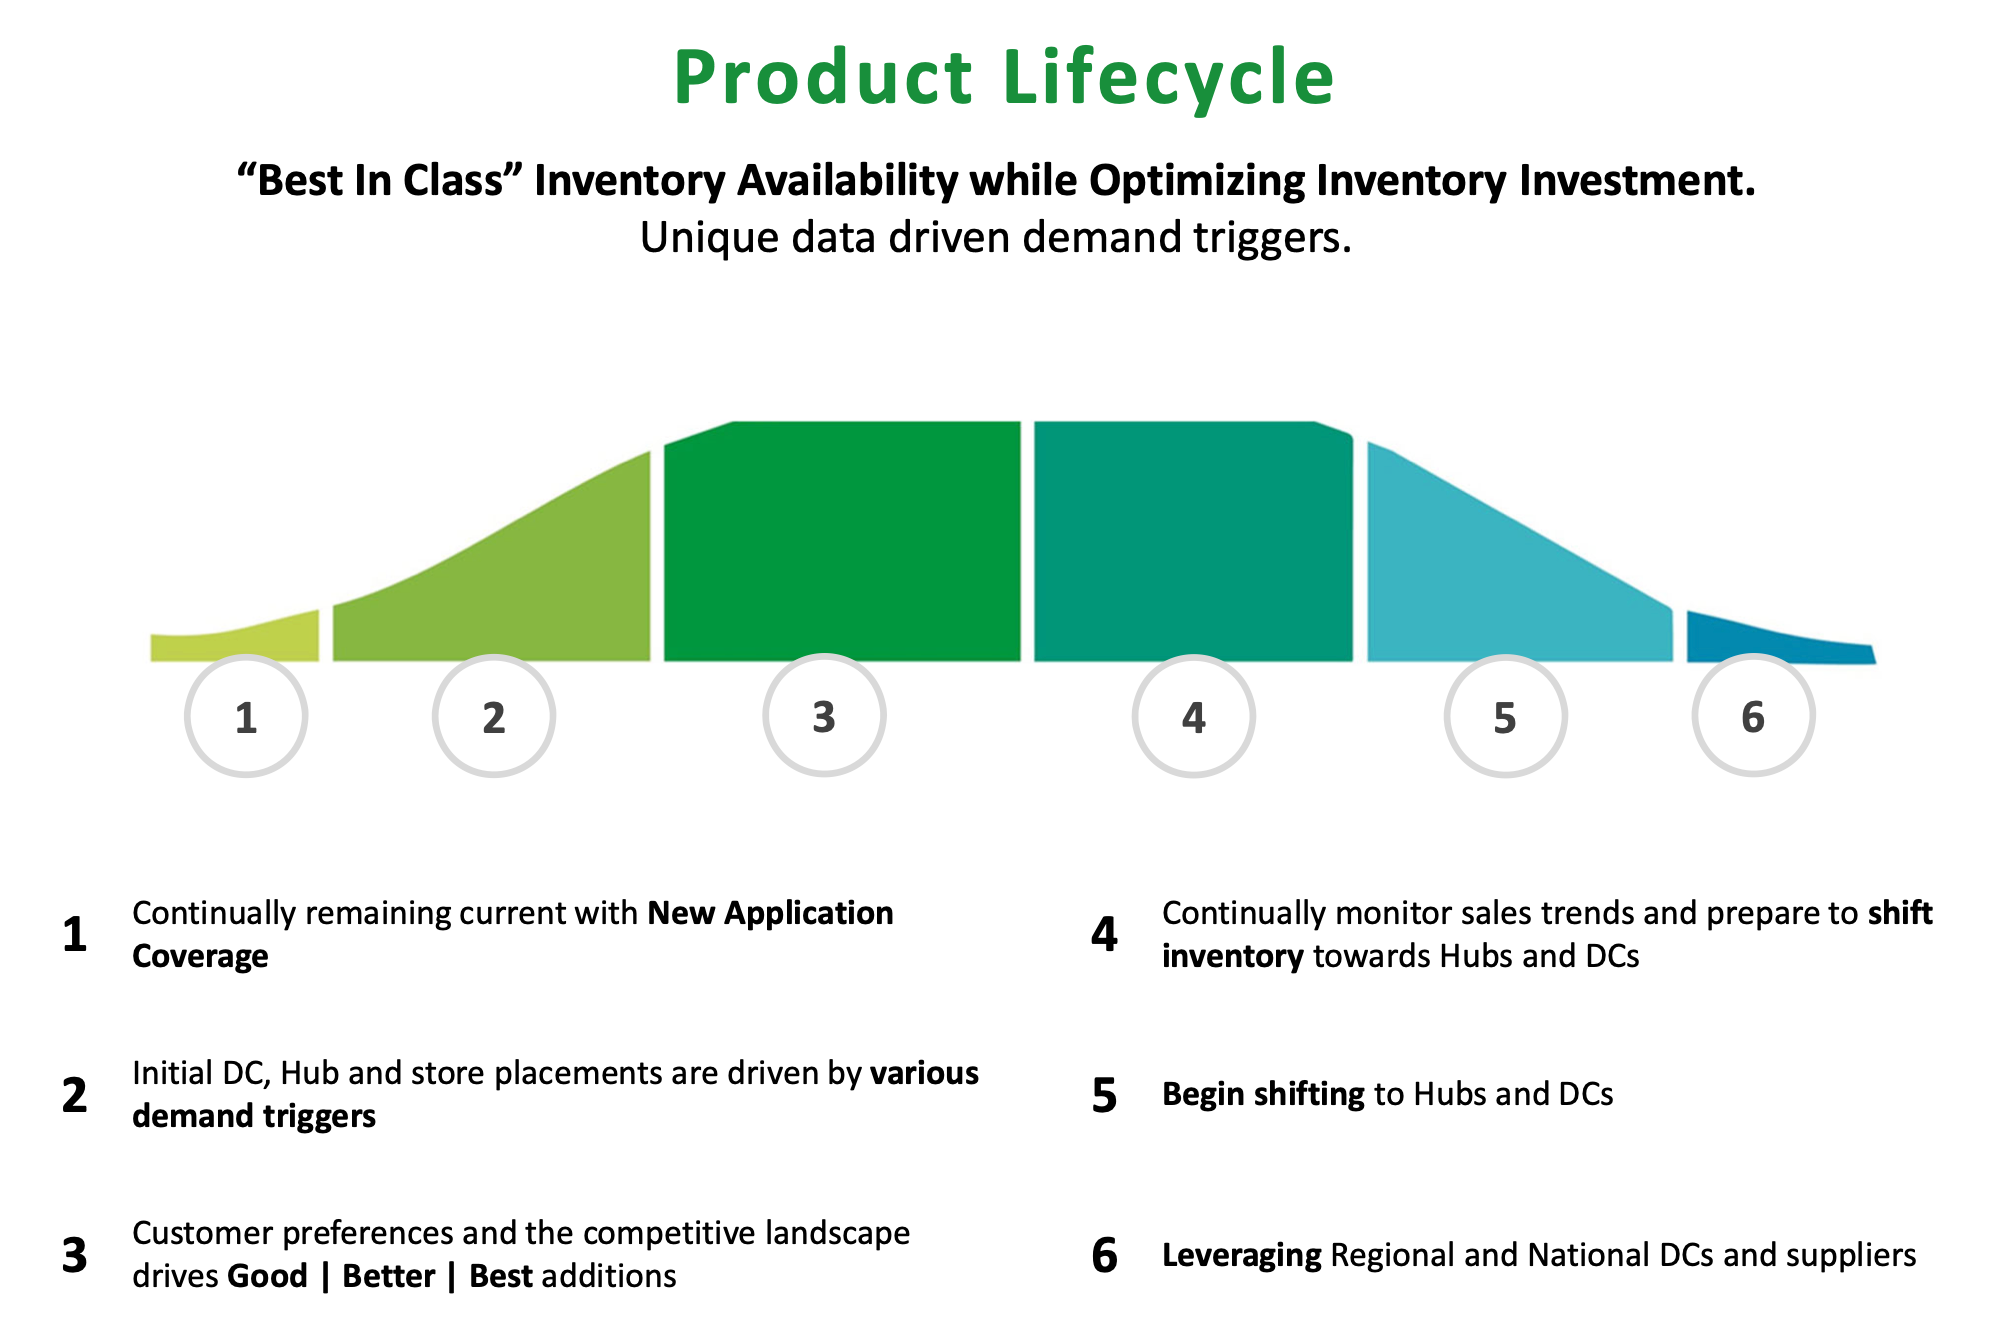
Exhibit III - O’Reilly
Emerging Technology
One of the key reasons we're optimistic about the leading players in the automotive aftermarket is their ability to leverage technological advancements. While some investors have expressed skepticism about ORLY’s and AZO’s buyback programs, as well as concerns about their negative equity (resulting from buybacks and negative working capital), we see these strategies as part of a broader, forward-thinking approach.
Another concern for some is the potential threat posed by electric vehicles (EVs). While it's true that EVs will likely require fewer repairs overall, the increasing complexity of vehicles—whether EVs, internal combustion engines (ICEs), or hybrids—will drive higher same-SKU inflation. This growing complexity will make it increasingly challenging for smaller players, who may struggle with inventory availability, to keep up with technological changes, adapt to evolving demand, and manage inventories with limited shelf life. Consequently, we believe that macroeconomic and industry-specific shocks will likely accelerate market share gains for dominant players like ORLY and AZO.
So I wanted to provide a quick update on how we look at that, how we're thinking about that here and vehicles are going to continue to evolve. They have since their inception, and we expect them to continue to. The great news is a lot of that evolution is good news for our industry and good news for the future for us. start-stop technology, which is on many vehicles, I'm sure many of you drive a vehicle that has a start-stop capability to it.
Over 50% of the vehicles that were sold new in 2023 had start-stop technology on them. The thing about Start-Stop technology it's additive parts. It's added sensors, it's beefed up alternators and electrical components that have the ability to measure the charge of your battery and shut the car off and restart the car. Well, while those things are engineered to a heavier standard, the failure rates on them are exactly the same as the old models, at least what we're seeing so far in the industry. And this is additive business for us. It's a higher ticket, and it's not an improved failure rate. So it's continued business for us for many, many years. This is a tailwind for our industry and for our opportunity for the future.
But if you think about all the other components of the car, nothing is taken away. We think about brakes, suspension, you think about heating, cooling, electrical, all those other components of the vehicle, they're all there. And as a matter of fact, in EVs, most of those are under more stress due to the weight of the vehicles and the heat that's generated from the battery. So we see higher failure rates in many cases of those basic components in EV vehicles than we do in ICE vehicles. And our suppliers are very quick to begin to bring those to market as we learn more about those. So we see the evolution of the car and the vehicle as an opportunity and a tailwind for our industry if you think about it long term. - Brent Kirby
On EVs, it’s likely to be a positive for the following reasons that the former CEO, Greg Johnson, pointed out in 2022:
We are working very closely with our supplier base on the evolution of EVs, and many of those suppliers are also OE suppliers. So they're there with leading-edge technology, they're providing to the OEs to make sure we have components in the aftermarket. But obviously, there's no internal combustion engine in an electronic vehicle. We sell a lot of oil changes.
What I would tell you is, aside from that type of maintenance internal engine components is a declining category for us. Engines are built so much better than they were 10 or 15 years ago. The gasket sets, the pistons, the rebuild components is a declining category anyway. So from an internal combustion engine perspective, yes, that component is gone, and there's not going to be the oil changes. So that would be one, the pressure on that.
Before I continue on, I'm going to tell you my opinion on that. I think the pace at which EVs are adapted or adopted is much lower than what a lot of people are expecting or projecting I mean, when most of the people in this room probably live in larger metro markets, that the EVs work pretty well in those markets. When you get out into rural America, out into the Midwest, where people are pulling boats to the leg, people are driving a lot of miles. The EVs are going to be more challenged in those markets.
Back to your question. On the good side, I mean, there's trade-offs. I mean there's - and I can talk about this literally all day long. There are also a lot of additional cooling components to EVs and we're working very closely with one of our suppliers on that.
So even though you don't have internal combustion engine, now you have multiple electric motors driving that vehicle, multiple electric motors and a very large battery pack result in a lot of heat generation. So you have to have the cooling systems on EVs are going to be much more elaborate than what they are on internal combustion engine vehicles. So that category is good for us.
Brake category is kind of up in the air. When you start talking about Tesla and some of the initial EVs that came out, they had single-stage motors, some of you may own those vehicles and drive those vehicles, you led off the accelerator of the vehicle naturally slows down. which is a reduction on braking. Some of the higher end and emerging EVs, especially some of the Europeans are coming out with multiple stage motors, which is essentially operating kind of like a transmission.
So when you get that to where you've got multiple stages and as you drive faster the ratios change, it also changes on the back end. So as you slow down, you don't get that same resistance slow. So breaking could be a wash in that category.
Part II - Competitive Landscape: ORLY vs. AZO vs. AAP
On the competitive landscape, we believe that there have been some significant recent shifts that are likely to strengthen the growth and shareholder value creation profile for ORLY.
YoY Comps & Two- and Three-Year Stacks
Our view, and we have exhibit IV to back this up, is that we’re in an environment of softening consumer demand that’s started around the middle of 2023, and one that’s difficult for many players to handle.
While it may seem counterintuitive, this environment is ideal for the strongest players to solidify their leadership. The CEO of ORLY has oftentimes spoken about "playing from a position of strength" and, on the 2024 Analyst Day, he even mentioned that they welcome "some pressure". They aren’t sadomasochists at ORLY, but during tough times, they know they’ll excel in building a reputation for industry-leading performance.
When retailers talk about two-year stacks, they refer to the sum of the last two years’ comparable growth rates. At the Compounding Tortoise, we strongly believe in compounding, which is why we calculate compounded stacks.
Also, please note that because of the COVID-crisis, the Q1 and Q2 stacks (highlighted in exhibit V) could show volatility as AAP’s and AZO’s reporting periods don’t match ORLY’s and GPC’s. Plus: GPC has significant exposure to DIFM/professional, and it comped very negatively during the lockdown quarters of 2020.
Exhibit IV - The Compounding Tortoise
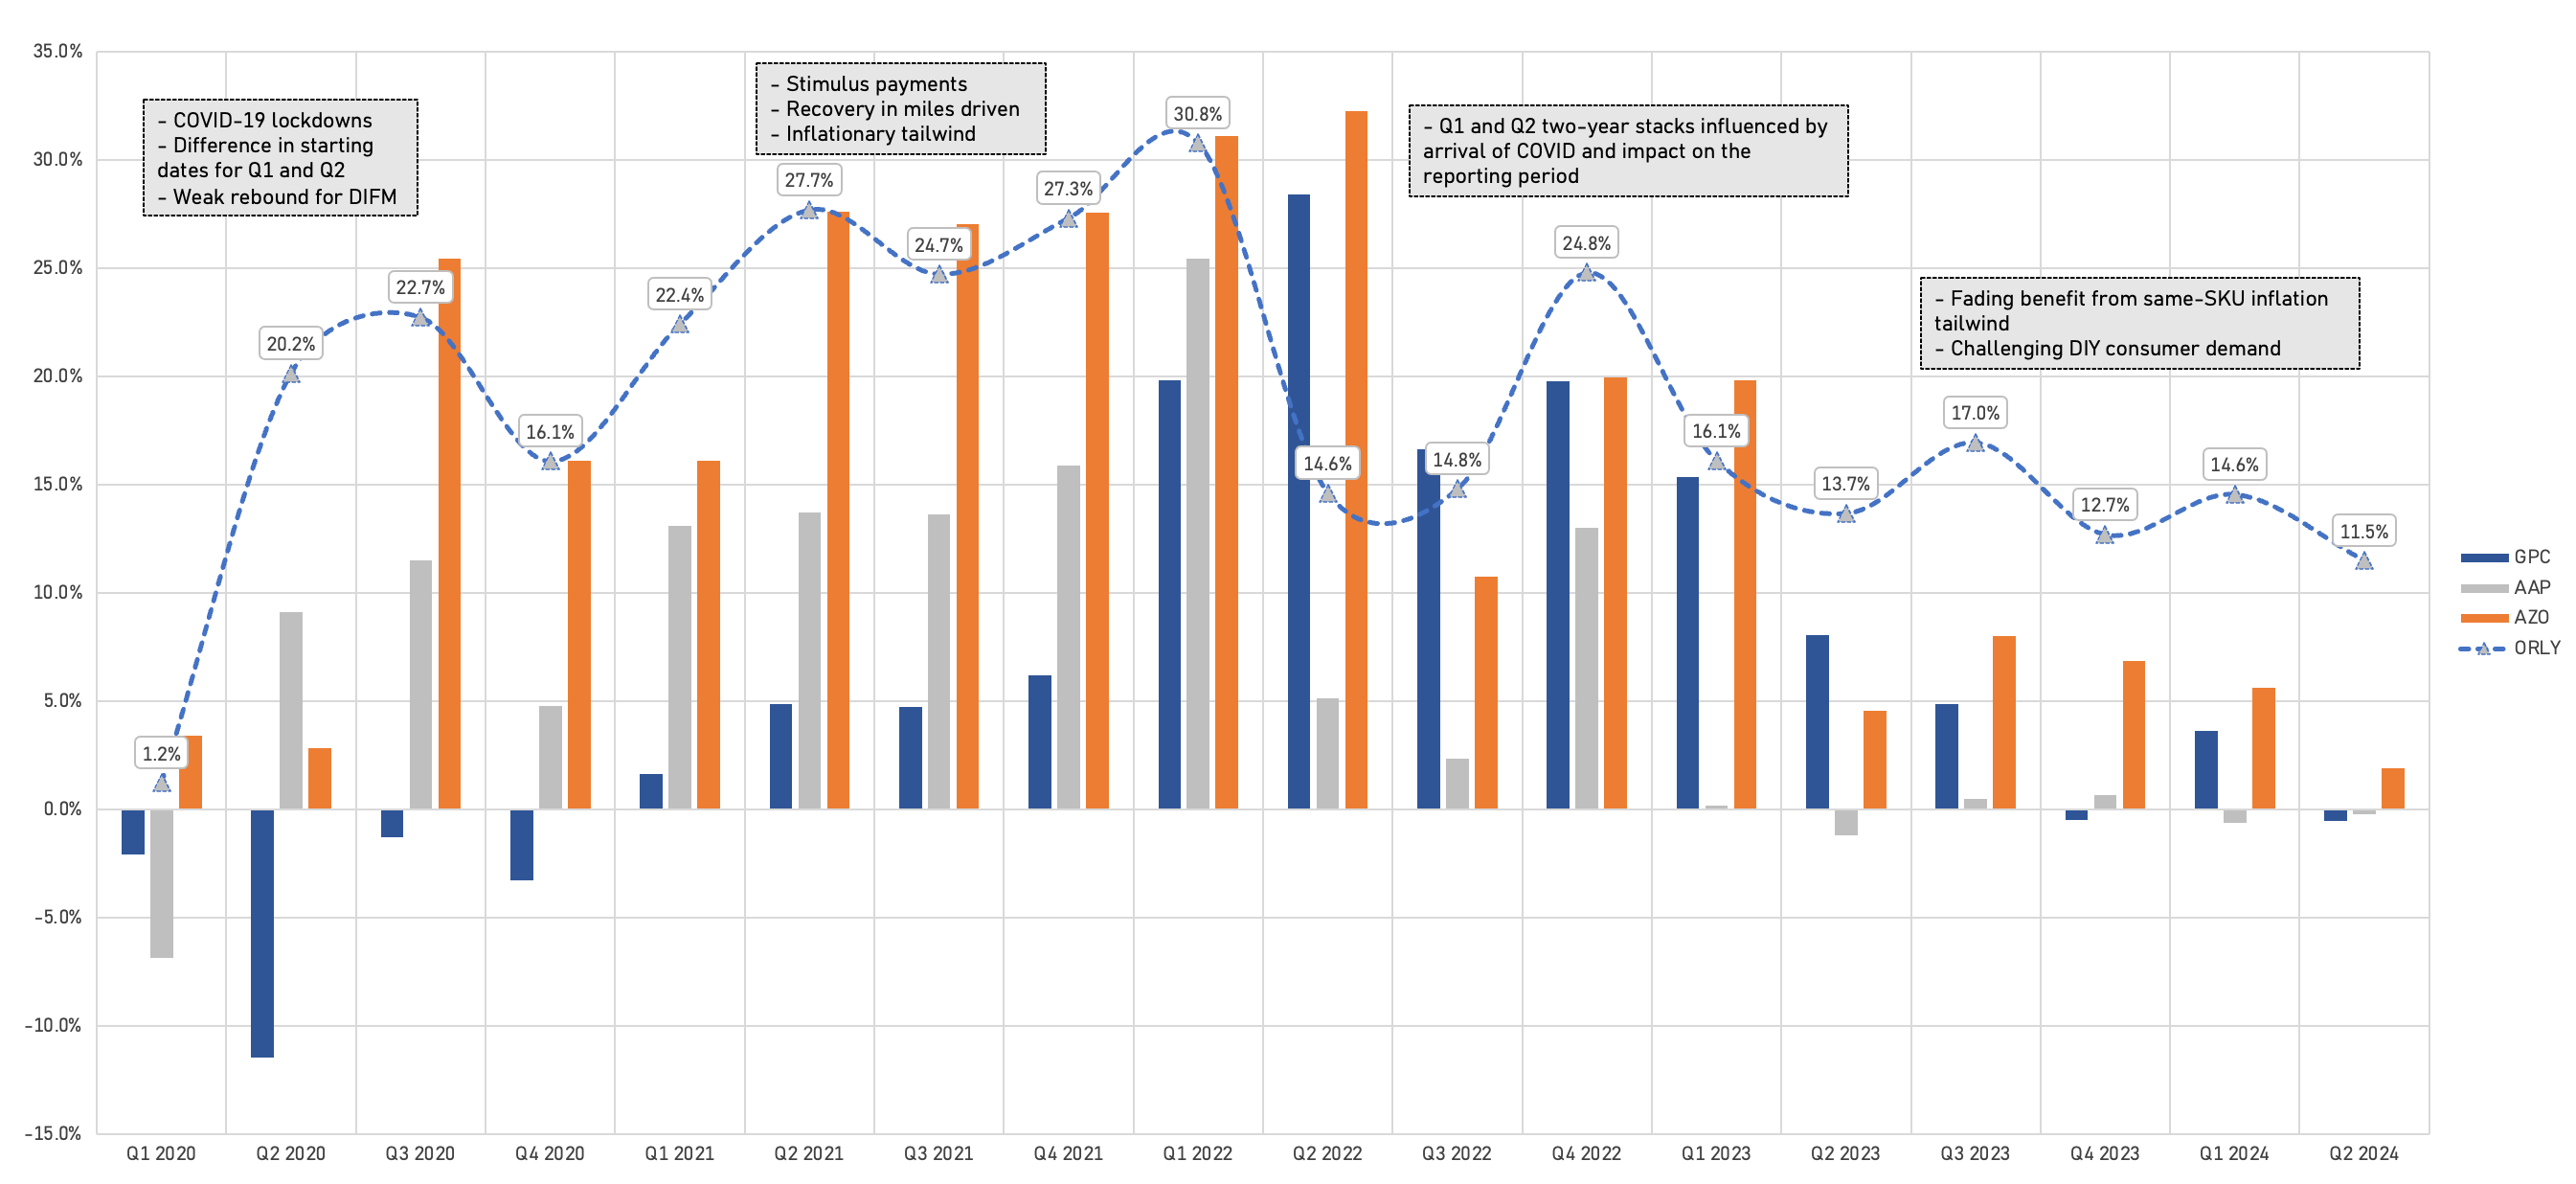
Exhibit V - The Compounding Tortoise
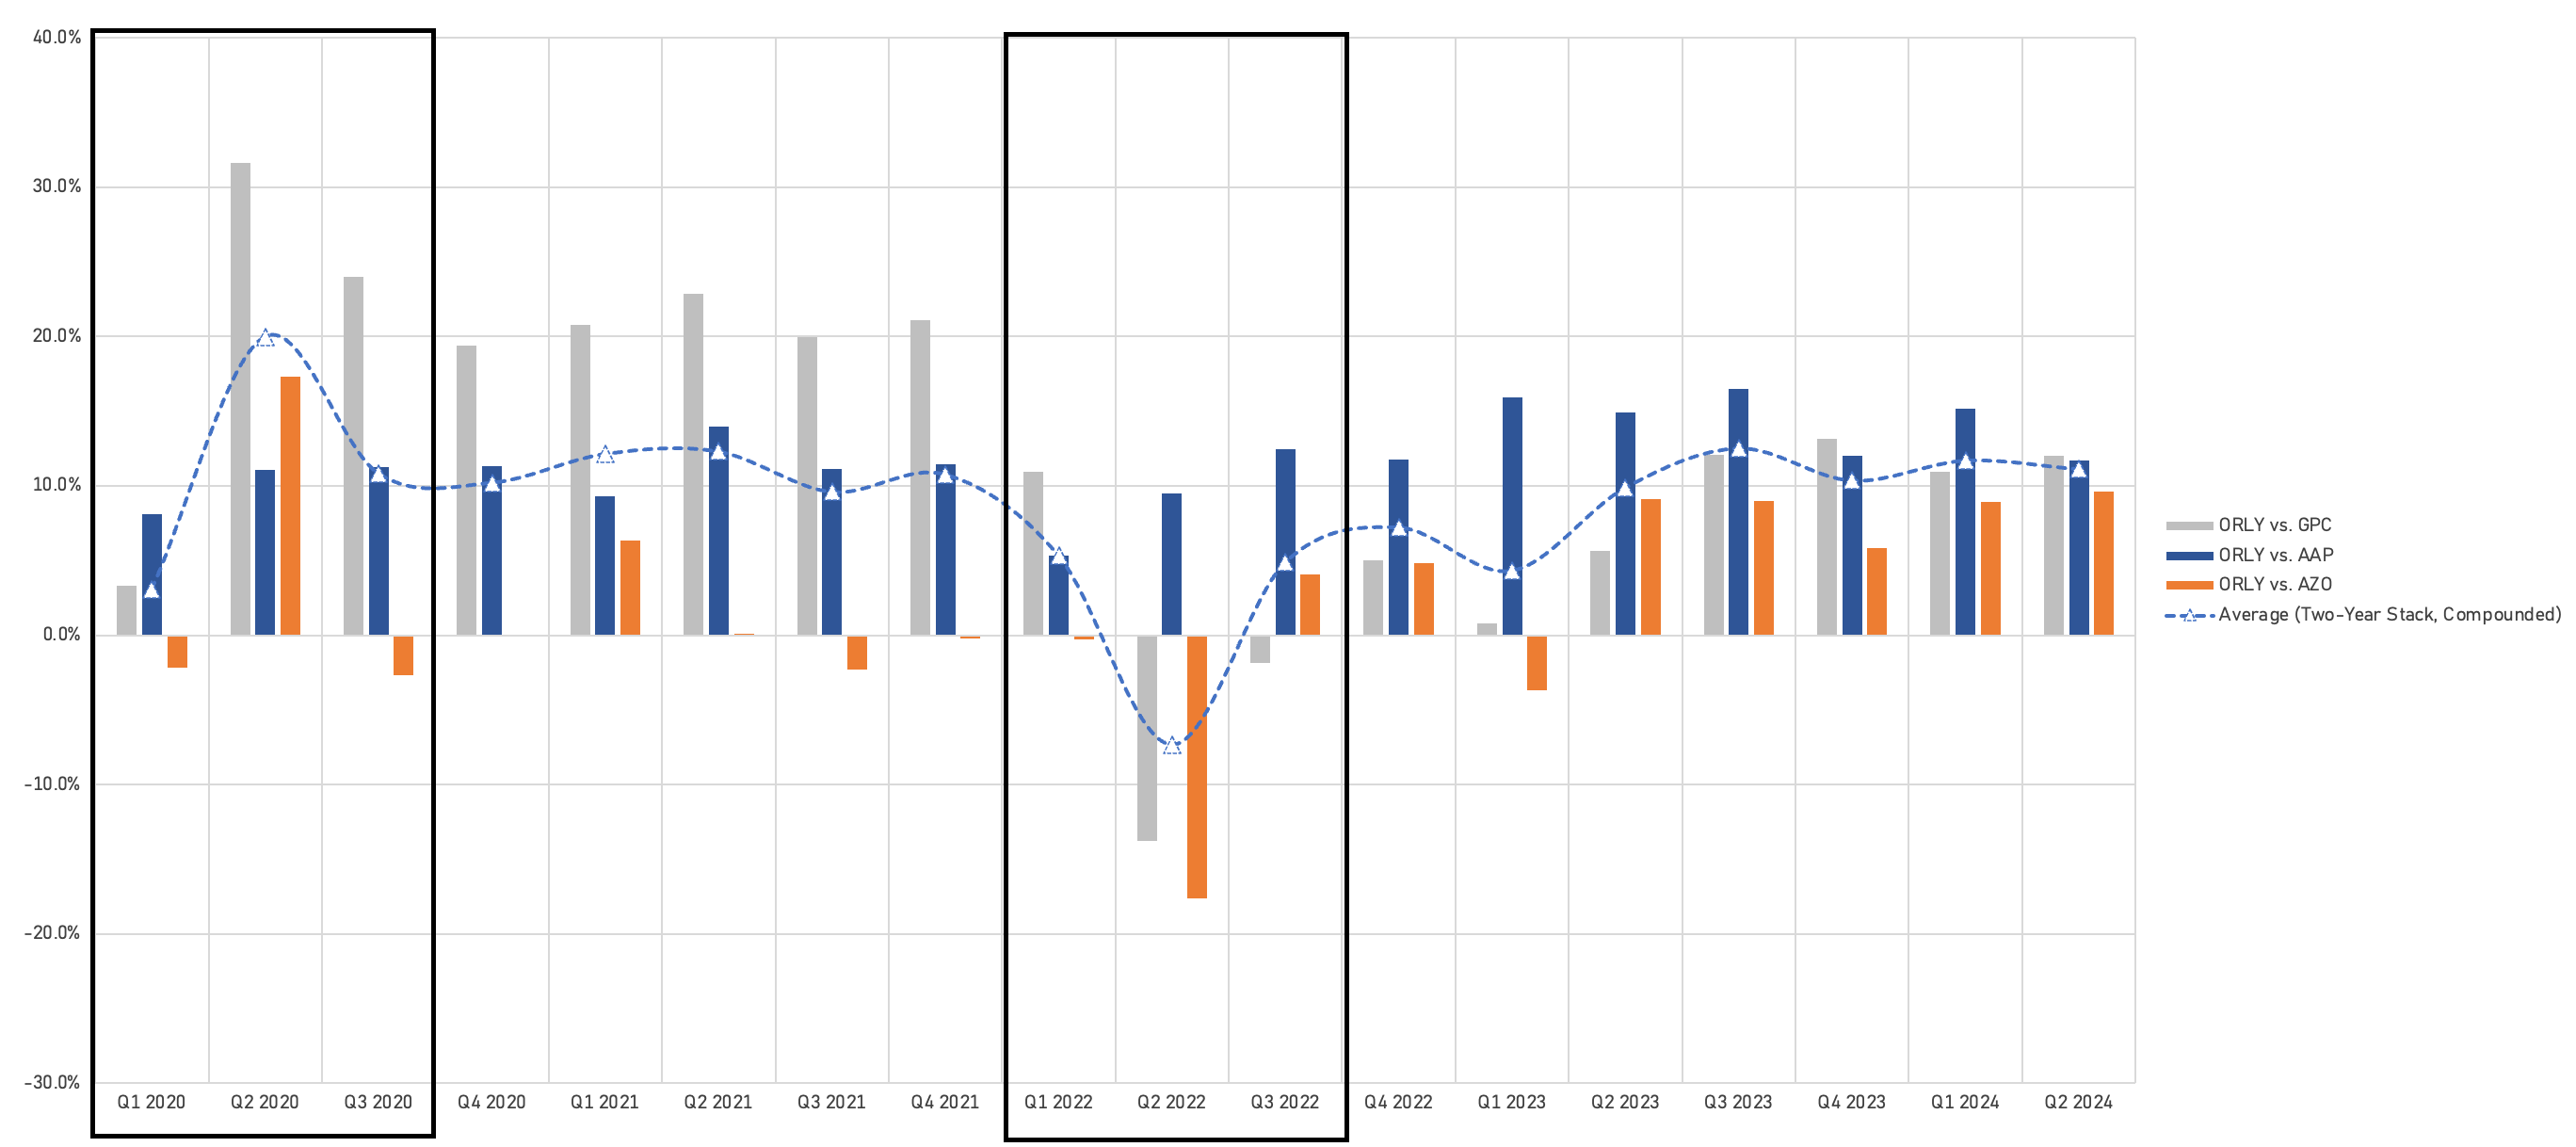
A clear conclusion can be drawn from recent trends in the automotive aftermarket: many companies experienced a surge in DIY demand driven by stimulus payments and customers having more time on their hands, followed by pricing tailwinds, and are now seeing performance normalize.
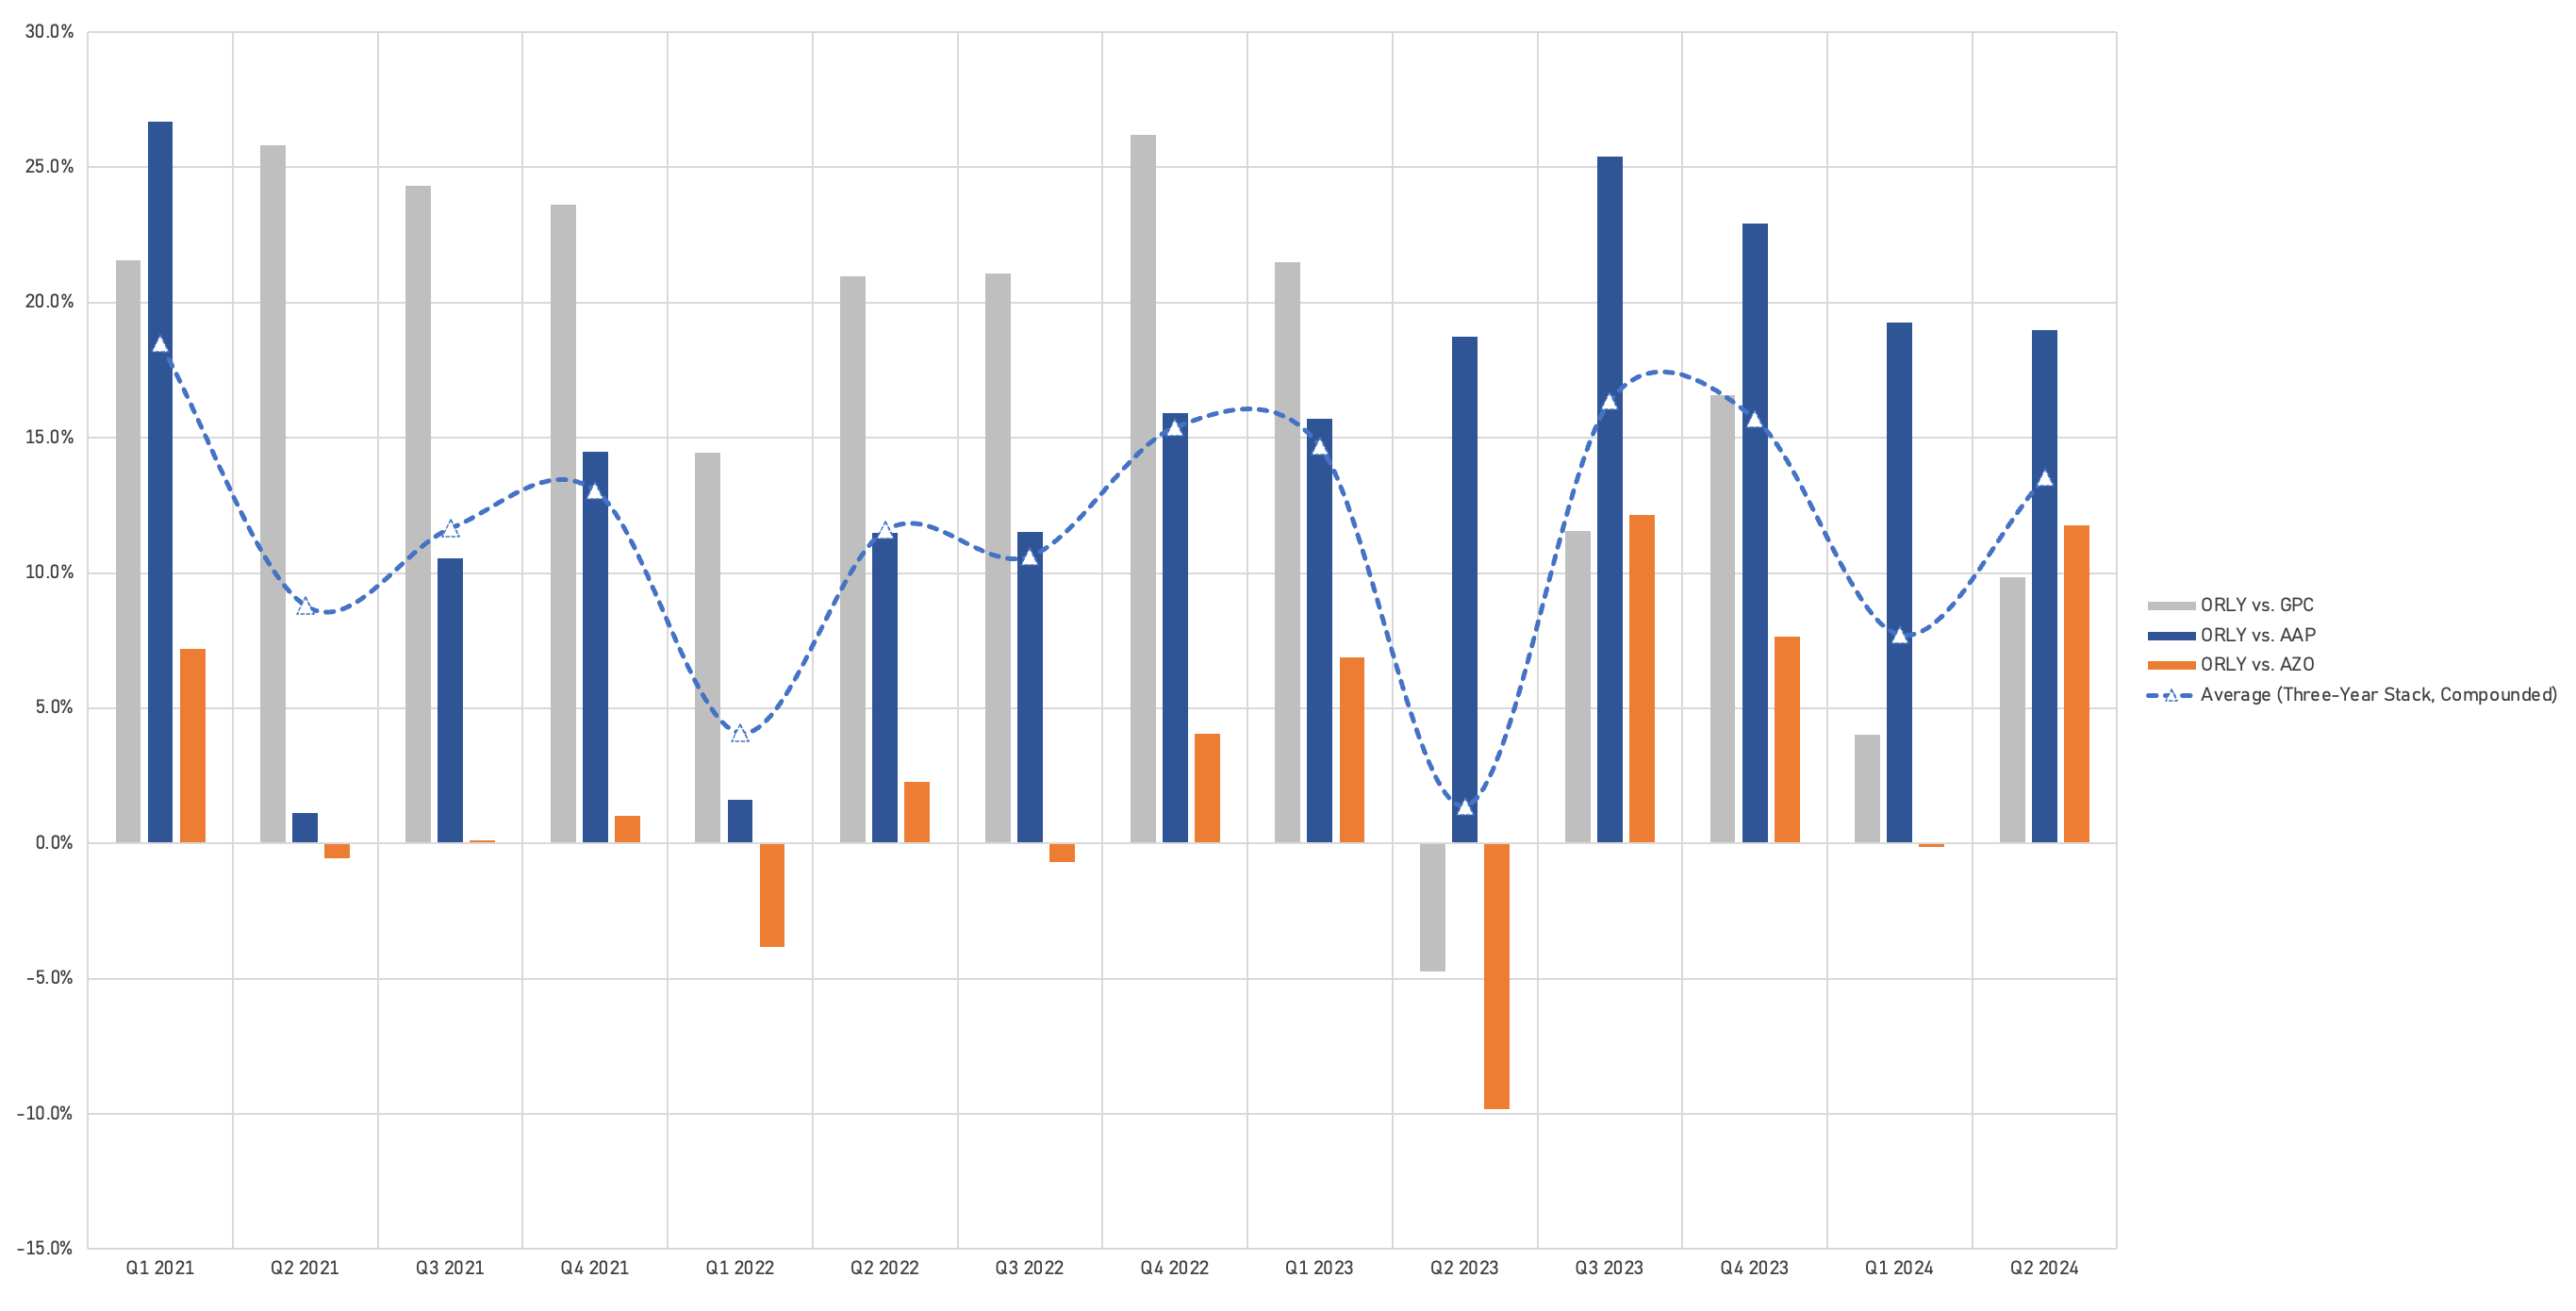
While there may have been some pull-forward in demand, this was mostly confined to discretionary items, which represent a small portion of ORLY’s business (likely less than 13%). Discretionary items have grown less than essential failure and maintenance categories, so the negative impact of this mix headwind to overall top line growth will likely diminish over time.
Exhibit VI shows the three-year stacks, while exhibit VII depicts the difference between ORLY and its direct peers.
Exhibit VI - The Compounding Tortoise
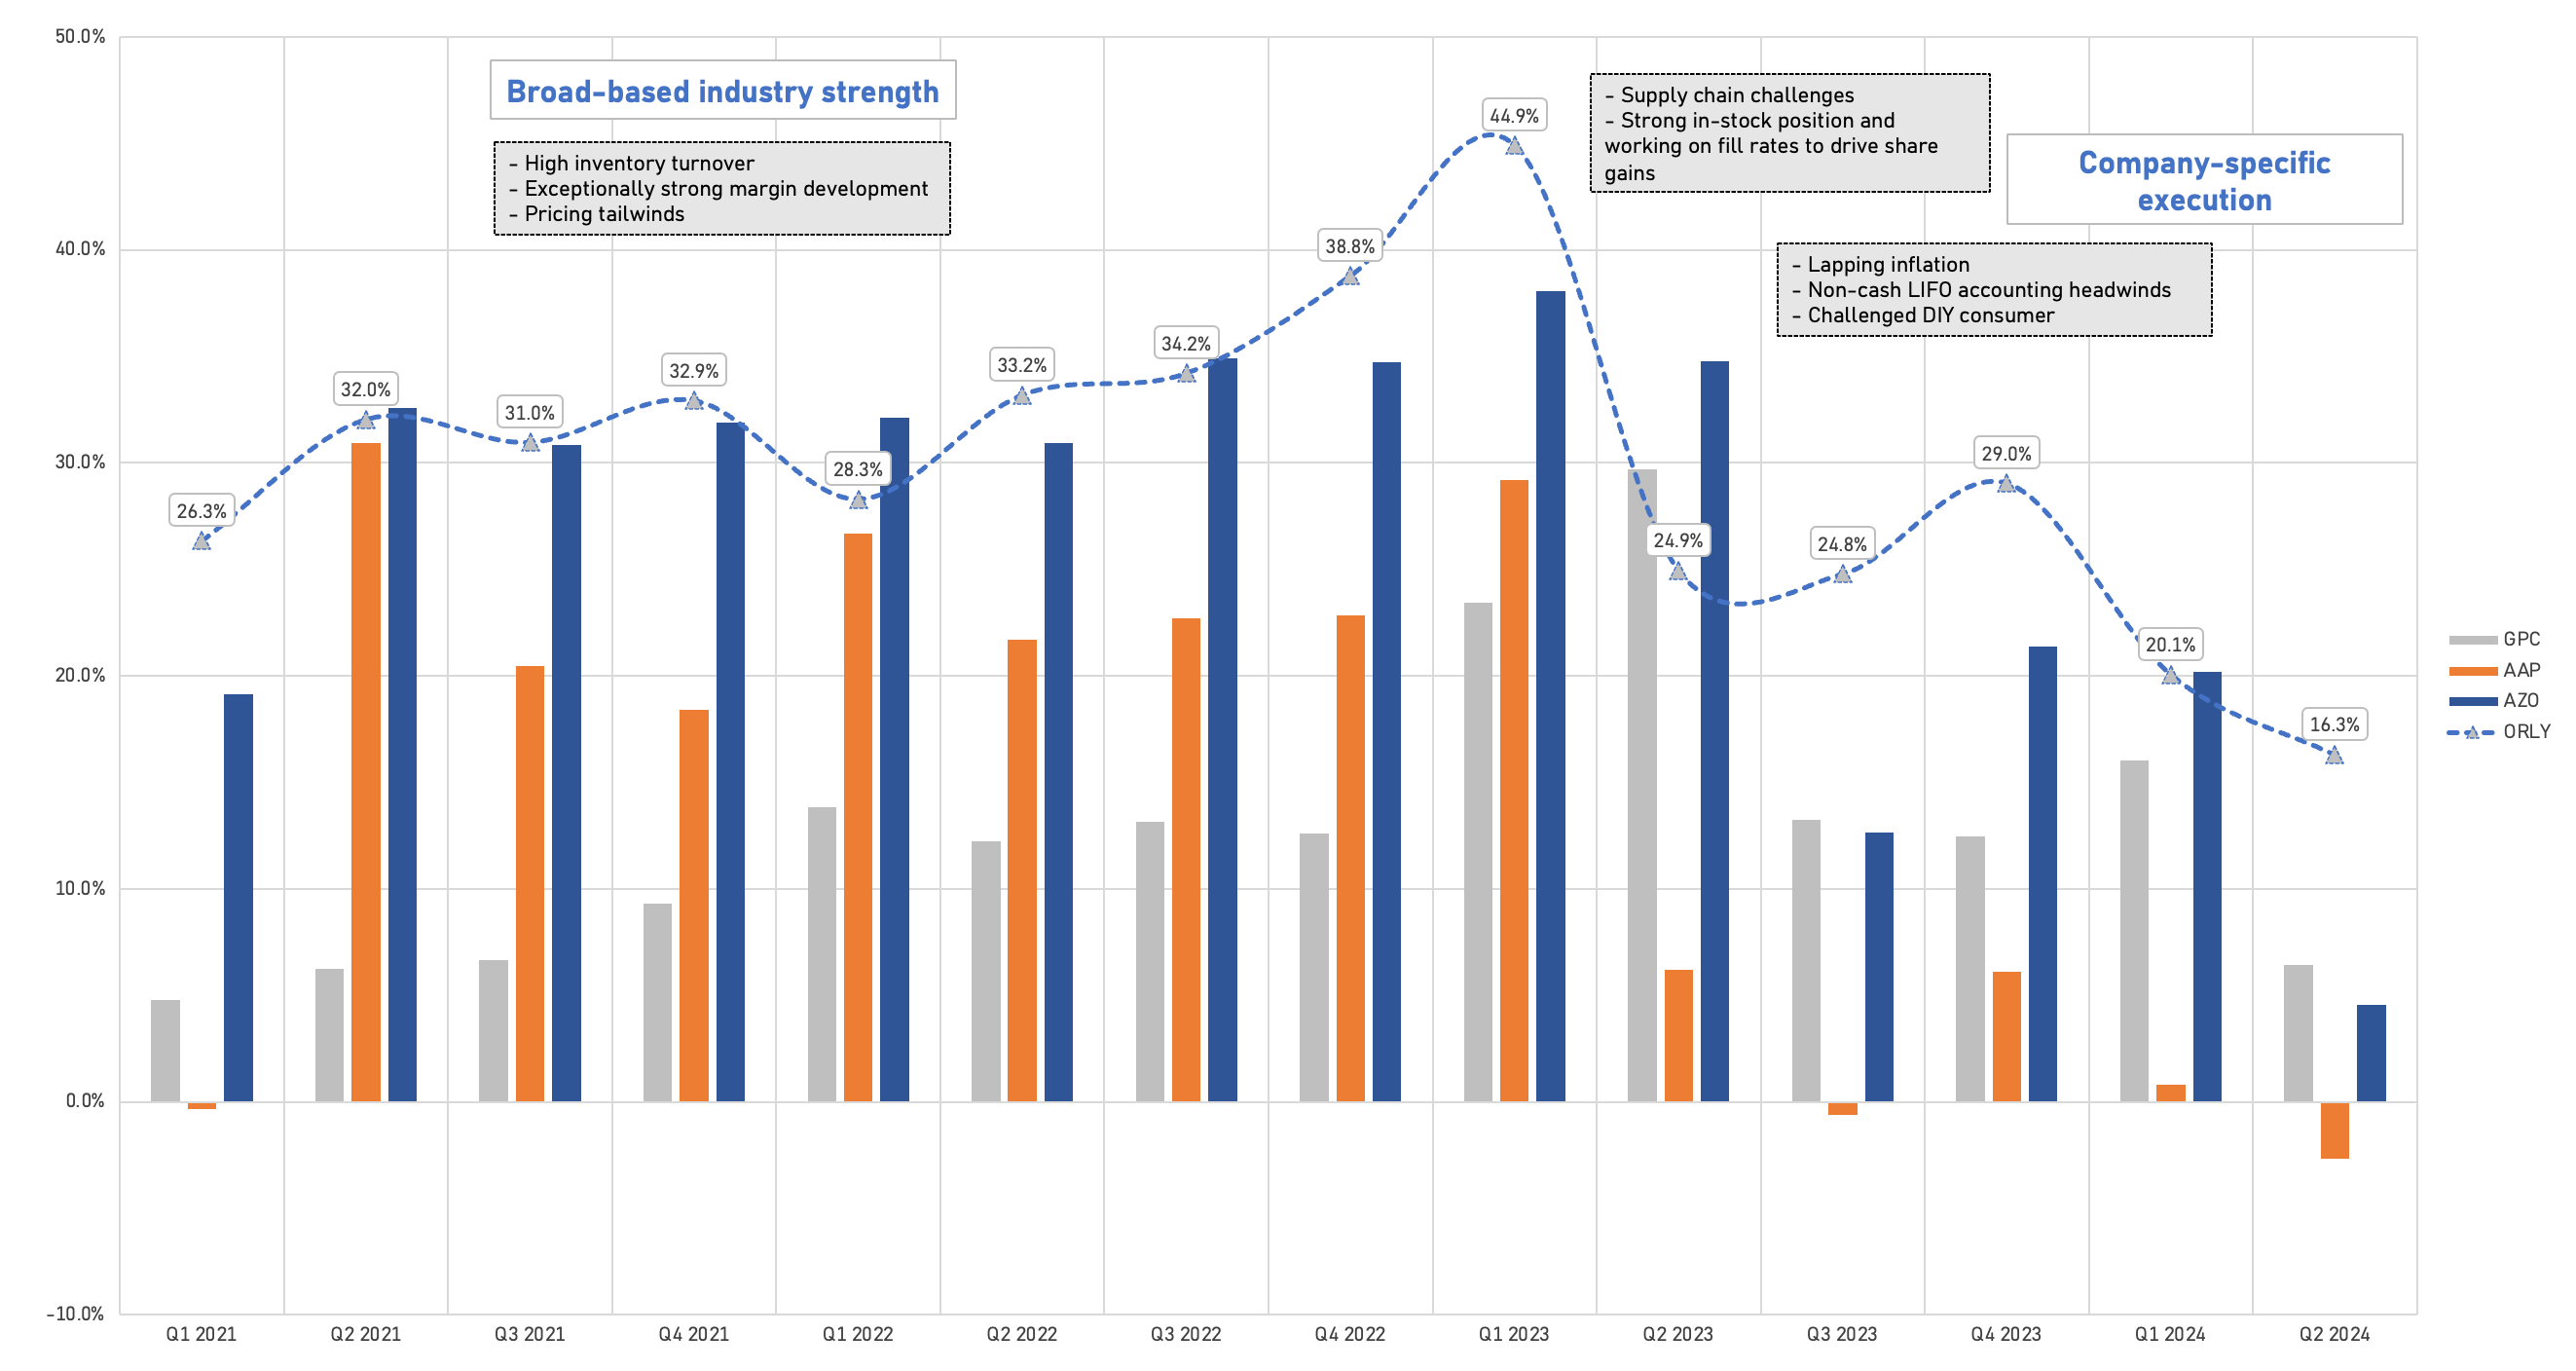
Exhibit VII - The Compounding Tortoise
Market Share Gains on Both Sides of the Business
Just like its three largest competitors, ORLY’s follows a dual market strategy, catering to both Do-It-For-Me (DIFM) and Do-It-Yourself (DIY) customers. However, the company's origins are deeply rooted in serving DIFM customers. These customers are typically technicians at independent repair shops who work on vehicles that are generally 6-11 years old and have recently come off the manufacturer's warranty. Repair technicians often bill their clients based on predetermined labor hours, even if they complete the job in less time.
Since vehicles occupy valuable space in a shop, the faster a job is completed, the sooner that space is available for the next project. For this reason, parts availability is the most critical service an auto parts retailer can offer to DIFM customers. "He who has the part, wins."
Price is a secondary consideration (or even fourth down the list), as labor costs make up a larger portion of the end customer's bill, and repair shops typically apply a mark-up on parts. When a technician needs a part to complete a job, they usually start calling various auto parts stores to check product availability and pricing.
We estimate that over the past 14-15 years, ORLY has increased its market share in DIFM by >150%, similar to AZO, but off a higher starting base. In DIY, AZO’s market share has stabilized at high levels, while ORLY has taken share from primarily AAP and GPC, and other competitors (the two-steppers, the independents).
AZO vs. ORLY
As we look at AZO and ORLY, they’re not identical businesses. The former capitalizes on the international opportunity, a stable DIY outlook, and an effort to reviving the comps in DIFM. And we certainly believe there’s room for two dominant players, while Advance Auto Parts and NAPA (GPC) are likely to comp negatively over the foreseeable future.
Let’s consider the following three differences between AZO and ORLY:
(1) Profitability - LIFO
As is common practice amongst US retailers, ORLY determines inventory cost using the last-in, first-out (in short, LIFO) method but had, over time, seen its LIFO reserve balance exhausted, resulting in a LIFO inventory value above replacement cost prior to Q3 2021.
ORLY’s policy is to not write up inventory in excess of replacement cost, and accordingly, it had effectively valued our inventory at replacement cost. Consequently, previously, up until Q3 2021, during that time, as acquisition costs and selling prices increased, ORLY benefited from selling inventory that was valued at a lower historical cost (just like AZO). This created a temporary boost in gross margins, which then resulted in a relative comparison headwind to FY22 performance as this benefit dissipated. From a balance sheet perspective, rising costs increase ORLY’s LIFO inventory credit balance, which is a standard outcome of the LIFO calculation. However, ORLY does not view this as a separate charge to gross margin because its evaluation is based on current acquisition costs and selling prices.
As such, ORLY didn’t record non-cash LIFO charges during its FY22 and FY23 P&L. This is in contrast with AZO’s approach of recording LIFO charges, and then taking LIFO credits back through the P&L to offset previous charges. Aside from the application of LIFO, there’s also a different ROIC and comparable sales growth picture for ORLY vs. AZO. Essentially, we view them as complementary positions in our portfolio, rather than identical copies (although they’ve shown highly positive correlation over the past years).
(2) Operating leases and finance leases
AZO has finance leases (as evidenced by the repayment of lease liabilities in its financing cash flows and higher depreciation), while ORLY has all of its agreements under operating lease.
(3) Country and DIY vs. DIFM mix
Following the acquisition of the Mayasa stores in Mexico in 2019, and last year’s deal to buy 100% the Canadian Del Vasto, ORLY’s store footprint is now 98.5% US domestic. AZO, on the other hand, has 12% of its store count outside the US.
Given that it takes time to ramp up the store network, increase density, and thus harvest efficiency gains, we believe "International" is dilutive to both AZO’s and ORLY’s profitability and ROIIC. On the other hand, Mexico has a compellingly aged car park (similar to the US in the 60s or 70s), and the adoption of hybrid vehicles, let alone EVs, is likely to take decades. At the same time, there’s a lot of market share potential in these markets that isn’t shown on ORLY’s total addressable market slide which only talks about the domestic fragmentation.
Exhibit VIII - O’Reilly
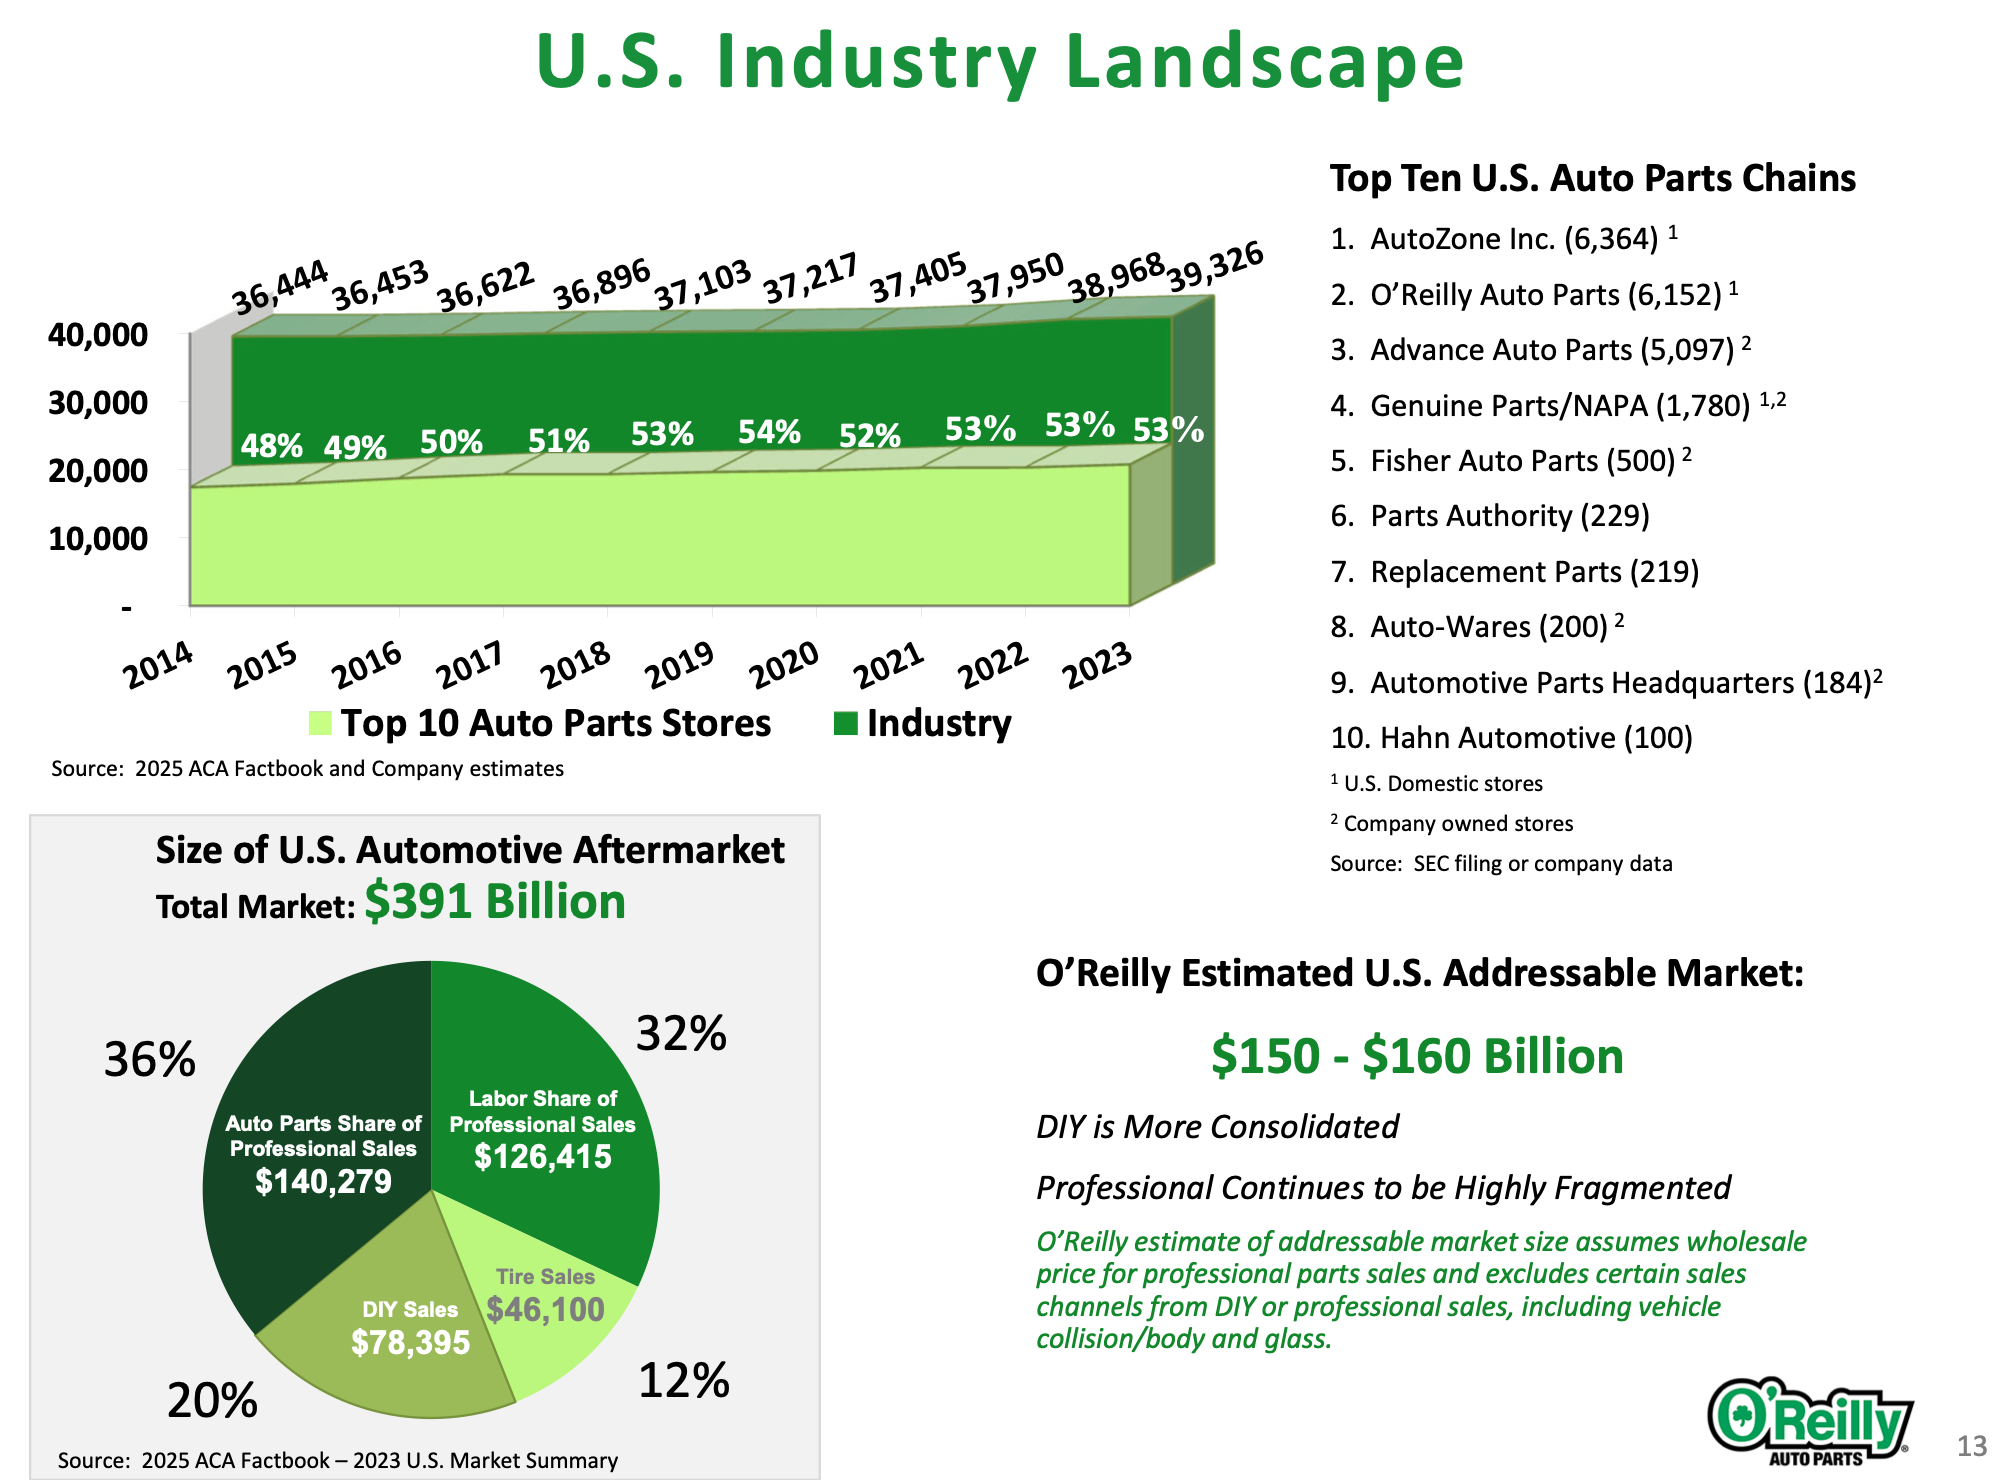
On DIY vs. DIFM, AZO is now at 30% DIFM vs. ORLY’s 47-48%. DIY is more profitable than DIFM, but time will tell if increased consolidation leads to incremental margin benefits on the commercial side.
Regarding the international growth opportunity, ORLY’s management admitted that they’ve lost some time due to COVID, allowing AZO to continue to make strategic investments. In fact, CEO Brad Beckman somehow applauded their decisions.
We couldn't be more excited about our international markets. Obviously, North America, building out North America made a lot of sense for us contiguous to the US. And we've had extreme success in the markets the border of Mexico. And quite frankly, our largest public competitor has done an unbelievably good job in Mexico now since the late '90s. And they've kind of paved the way. They've done a phenomenal job down there. The average age of a vehicle is 16.5 years in the Mexican market, not good roads, and it's really a great parts market, even more fragmented than the US by far. - CEO Brad Beckham
Advance Auto Parts - Will It Fail?
It may have gone unnoticed, but the largest near-term growth wildcard for ORLY and AZO could be the failure of Advance Auto Parts. It has 11 billion USD in sales, but faces internal challenges at a time when the broader industry is lapping the strong post-COVID period.
AAP’s situation has deteriorated so much with its Q2 2024 results that we now question the company’s pricing strategy and overall competitive viability. The revised pricing strategy could suggest that AAP is trying to ignite a price war, but the CEO has stated they are not priced below their national peers and have no intention of lowering prices. Stated differently, AZO and ORLY aren’t incentivized to reduce their prices to retain or keep growing their market share.
AAP did report a 0.4% positive comp growth, driven by the DIFM segment, while the DIY segment declined in the low single digits. However, the real issue lies in the drastic downward revision of their full-year profitability and cash flow guidance. Now, after incorporating its year-to-date performance, management provided new numbers that include Worldpac’s contribution. Higher product acquisition costs, including freight, faster DIFM growth, and pricing investments contributed to the decline in gross margin, while SG&A expenses continue to rise. We believe AAP needs significant sales growth to offset these cost increases at a time when pressure on the consumer is likely to persist.
Regarding Advance’s long-term competitive position, the CEO mentioned the auto parts industry offers an ocean of opportunities. While that’s true (and why we hold ORLY and AZO), strong working capital management, inventory availability, profitability, free cash flow, and balance sheet strength are critical to the longevity of top players. Looking at these factors, Q2 saw higher inventory levels but only a slight increase in accounts payable. We believe AAP’s working capital situation isn't stable enough to generate strong free cash flow. Consider this: excluding working capital changes, which have been solid as comps grow in the mid-single digits, ORLY’s underlying free cash flow before any growth CAPEX is around 2.8 billion USD.
For Advance, the projection is now 100-200m USD, after a 4.7m USD outflow in the first half. Note that this figure doesn’t account for share-based compensation as a cash expense. Adjusted for this, free cash flow was -32.2m USD. AAP is expecting significant free cash flow in the second half, but this seems overly optimistic given the anticipated decline in EBIT margin. The only potential tailwinds are 1) significantly improved inventory turnover and 2) stabilizing accounts payable (reversing the first half outflow).
Both require substantial sales growth, not just through pricing investments, but also through maintaining service levels (e.g., staffing) critical for repeat business. If they can turn things around, they might reach 400-500m USD over time, but the gap with the top two players remains substantial.
In the long term, they aim to maintain a 2.5x ratio, which is crucial for staying investment grade. However, even with the 1.2 billion USD cash inflow from the Worldpac sale, the medium-term free cash flow and dividend payments won’t bring them below 3x anytime soon. So, where will the capital for reinvestment, such as DC development or stock buybacks, come from?
Lastly, on profitability, cash rent expenses increased by nearly 4% year-over-year (23m USD), consuming 10% of the projected EBIT. Wage pressures persist, and retaining talent is becoming increasingly challenging. In conclusion, Advance Auto Parts is in a difficult position due to operational and financial struggles, and we doubt its ability to meet its updated full-year targets.
We’ve previously mentioned that Advance isn’t managed for the long run, which is reflected in many ways, such as the mix of owned PP&E and leased assets (at present value) as per their most recent quarterly filings (highlighted in exhibit IX).
Exhibit IX - The Compounding Tortoise
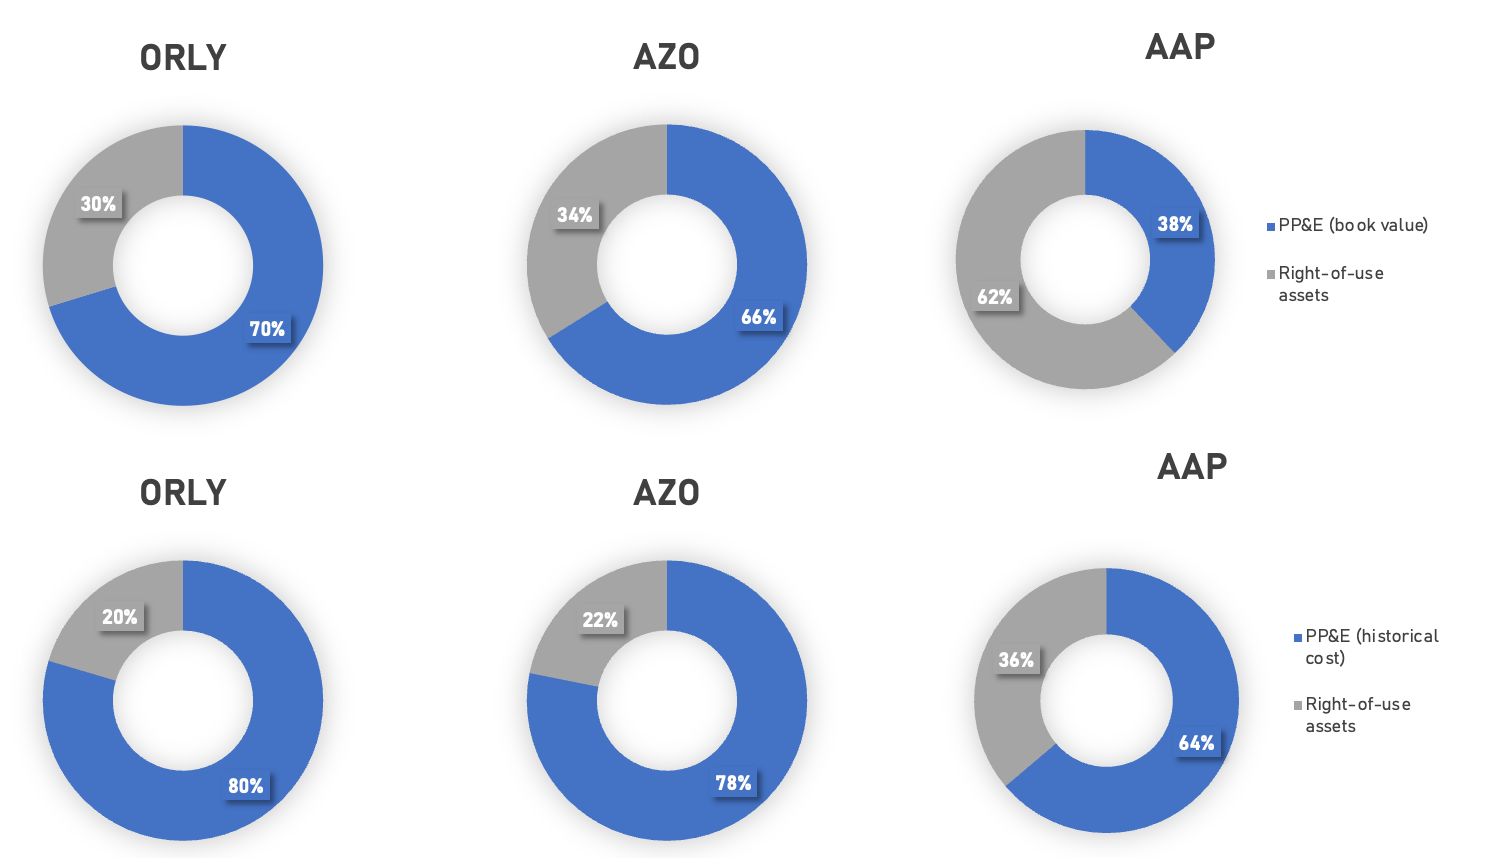
In contrast, the discrepancy between Advance Auto Parts’ property, plant, and equipment (PP&E) at book value versus historical cost highlights a lack of reinvestment in their business. Simply put, AAP’s distribution network isn’t optimized or efficiently managed to drive mid-single-digit comparable store sales growth.
This, coupled with statements from AAP’s CEO, suggests they may be somewhat in denial about the challenges they face in sustaining growth in the years ahead.
It's an ocean of Auto Parts, 287 million vehicles aged at 12.7 years. And if you look at the share of the folks that have that higher operating margin, yes, they certainly been growing. But in aggregate there's still a large swath of the market that they don't touch and that we don't touch. So there's room for us to grow without ever taking $1 or standing toe-to-toe with them and I think that's important. Secondly, in terms of just sort of bones, in terms of our ability to be out in the market, we have 4,700 retail locations. We work with 1,100 independents. And if you look at where we are, there are many markets where we are the leading player. So structurally, it's not as though to go out and compete with them, we need to actually go have stores and be in markets. We're there. - Q2 2024 conference call
Part III - Long-Term Track Record
Mature Markets and Profit Growth
Turning to ORLY’s long-term track record. It’s fair to say that it’s been relatively well documented: solid profit growth, margin expansion, >30 years of uninterruptedly positive comparable sales growth, buybacks. But let’s provide some more context on what we like most about ORLY: consistency.
Well, again, at O'Reilly, we work in a pretty boring industry and a pretty boring company in terms of it's very solid. And it's basic fundamental execution and its basic leadership of people. Again, no revolution needed. But that said, we're always going to evolve. I promise you Greg and Greg and David, our Board and most importantly, our 90,000 team members, they didn't give me this opportunity set still.
We're absolutely going to get better. We're going to absolutely evolve. And we have plenty of ways that you'll hear from the team that we can get better at how we staff our stores, how we take market share, how we get better at digital, how we get better at search. We always have opportunities to continue to get better. What's not going to change is our culture, our promote from within culture, our culture of hard work, focus on excellent customer service, those basic, again, kind of boring fundamentals. The culture is not going to change, promote from within is not going to change. But we are going to continue to evolve and get better. But we're very, very blessed to have this leadership team at the helm. - CEO Brad Beckham
ORLY now operates across 48 different states, with a stronger focus on the Mid-West, while AZO has equally good coverage across the US. Advance has a strong foothold in the East, which ORLY wants to attack over the next couple of years.
Exhibit X - O’Reilly
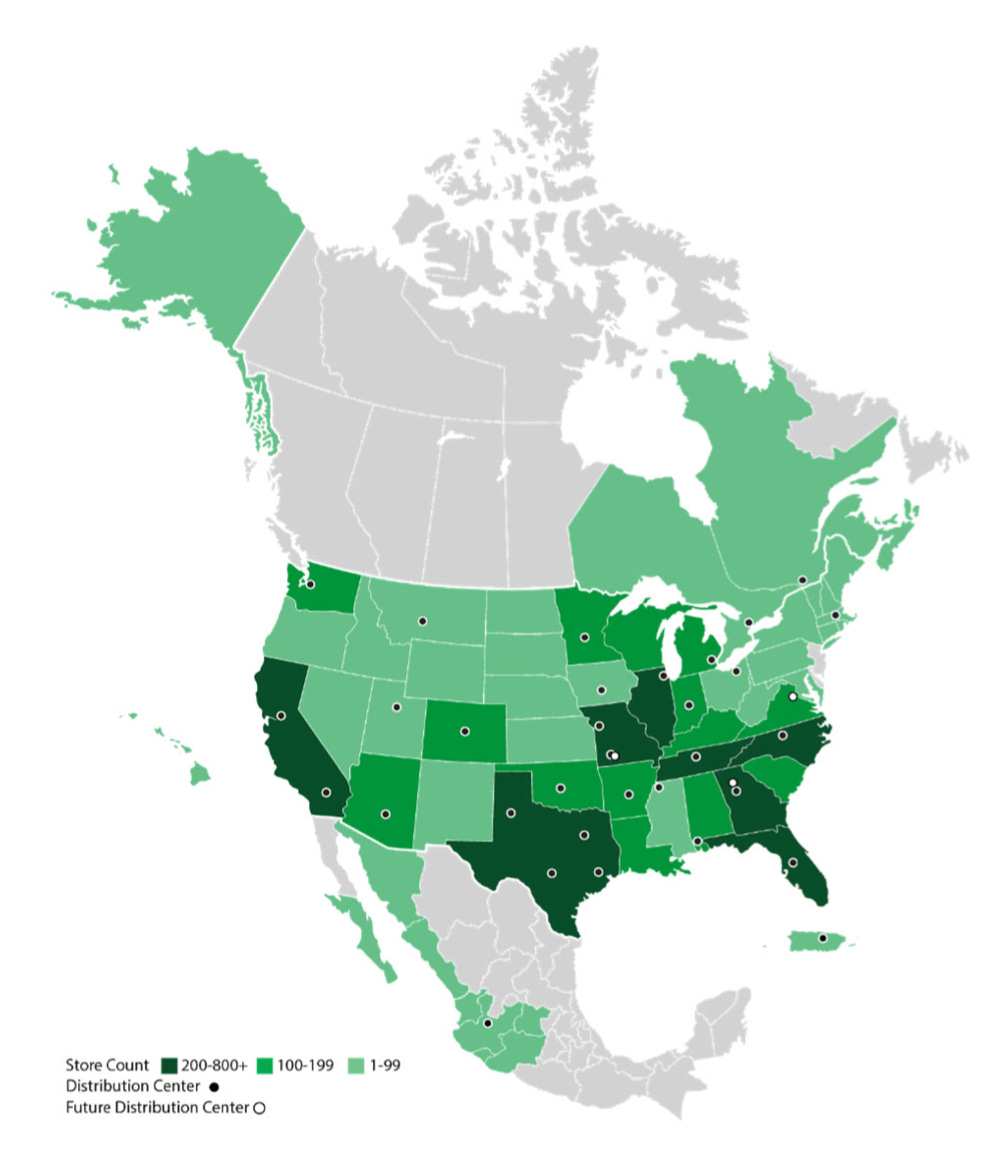
At the same time, it’s important to remember that in ORLY’s most mature markets being the Central Midwest, around Missouri, Oklahoma, Texas, it's not like it commands a 50-60% share, and then 3% or 4% share in Florida. It’s more around 15% to 20% in the most mature markets, with the best stores where there’s little competition sitting at 30%.
And so we still see a lot of opportunities. I mean, when we're doing what we need to be doing in our most mature markets, there's still plenty of share to take. - CEO Brad Beckham
As such, the growth runway for ORLY continues to be strong. Exhibit XI highlights the priorities for the use of capital. On the topic of consolidating the industry, ORLY hasn’t executed a sizable acquisition since the CSK deal in 2008 (1,342 stores). There were some smaller transactions like VIP Auto in 2012 (56 stores), Bond in 2016 (48 stores) and Bennett in 2019 (33 locations), but other than those, the focus has been on internal growth opportunities.
Exhibit XI - O’Reilly
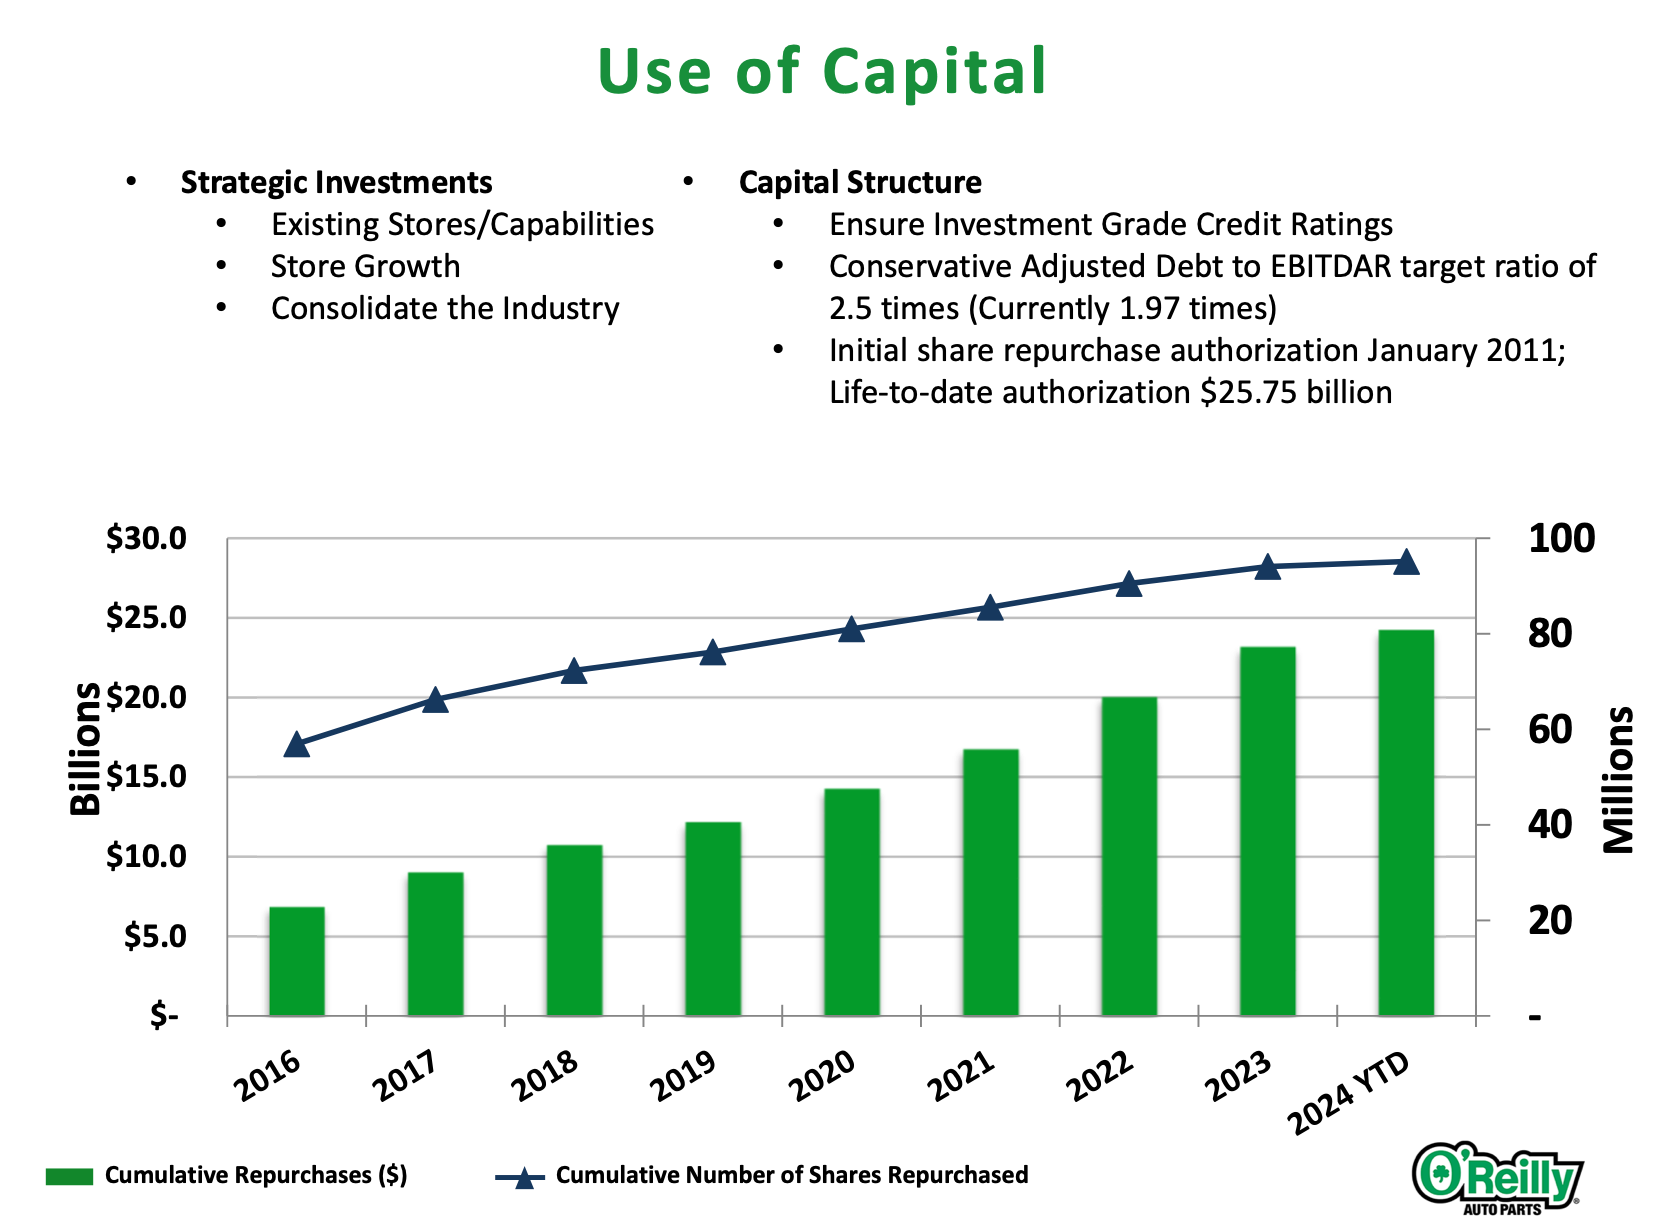
ORLY currently boasts industry-leading ROIC and profit margins, making organic growth the most rewarding reinvestment opportunity. Given ORLY's 15% organic reinvestment rate (including growth CAPEX and related net inventory investments relative to recurring NOPAT) and an initial ROIIC of 20-21%, the primary objective is to grow operating profit dollars.
Essentially, any investment that meets the near-term after-tax return hurdle (around 15% for AZO) should be pursued, provided there’s strong cash flow visibility for the project, whether it’s a new store, hub, or distribution center.
Additionally, ORLY has room to further improve its gross margins. The company's proprietary brands have gained significant traction in recent years, allowing ORLY to leverage SG&A across its existing asset base. These proprietary brands not only help diversify the supply chain but also enable ORLY to implement a dual sourcing strategy, balancing strong supplier fill rates with favorable payment terms.
As the Do-It-For-Me (DIFM) segment remains highly fragmented, we anticipate that further consolidation will drive gross margin improvements for ORLY (and AZO), much like what has been observed in the DIY segment.
Return On Invested and Incremental Invested Capital (Organic)
As we’ve talked about in many webinars, articles, and the AZO deep dive, there’s no silver bullet to computing return on incremental invested capital. ROIC itself is a backward-looking accounting metric of book value of reported invested capital and the current accrual profit, i.e. NOPAT. It’s always a guesstimate what ROIIC looks like, but it should be close to reality (better to be roughly right than precisely wrong). In other words, don’t take the high reported ROIC (that’s based on the assets’ book value) at face value to determine the supposed ROIIC.
Because of the working capital structure, solid profitability, and decent inventory turnover, O’Reilly’s ROIC is where it is today at roughly 50% (very uncommon for a retailer) versus pre-COVID levels of 25% to 30% (still very strong, but not that exceptional).
We observed that its core/organic invested capital (excluding goodwill and cash) actually declined from 5.59 billion in FY19 to 5.42 billion USD in FY23. This decline is driven by an increase in other current liabilities (which are non-interest bearing, as ORLY had no upcoming debt repayments in both years) and a higher AP (accounts payable)-to-inventory ratio. But even if you take the change in current liabilities out, the amount of incremental invested capital is low, relative to the notable increase in EBIT, suggesting the past years’ ROIIC has been truly superb (and it has been).
The reality is that ORLY’s existing base business (thus excluding all growth investments made during and following COVID-19) has performed exceptionally well over last several years. As such, we can model new store spend, including net inventory, the cost to build out a new distribution center et al, but parsing the actual performance of those growth initiatives out of the reported ROIC number afterward is difficult, if not impossible.
For ORLY, there are several moving pieces that impact initial ROIIC and the mid- to long-term value accretion from (tangible) growth investments:
same-SKU inflation;
split between growth in DIY vs. DIFM;
network density of expanding the store, distribution center and hub reach;
cadence in previously opened stores, hubs, and DCs, i.e. when do they gain traction;
working capital inflows, driven by ORLY’s sales volume, share gains, supplier engagement in vendor-financing program
Overall, we estimate ORLY's average near-term ROIIC, which includes growth CAPEX (assuming all new stores and distribution centers are owned by ORLY rather than leased from third parties) and net inventory investment, to be around 21%. This figure could gradually improve to 22-23% as the business scales. When compared to AZO, ORLY’s returns are more favorable because of:
higher inventory turnover;
higher comparable sales growth;
focus on US domestic market vs. AZO’s accelerated growth in Brazil and Mexico which is diluting overall profitability and ROIC;
The reality is that ORLY's existing core business (excluding all growth investments made during and after COVID-19) has performed exceptionally well over the past several years. While it's possible to model new store expenditures, including net inventory and the cost of building out new distribution centers, isolating the actual performance of these growth initiatives from the reported ROIC is challenging, if not impossible.
IRR on Growth Initiatives
Then we’re getting to the mid- to long-term IRR of ORLY’s new stores and existing stores, which is based solely on the cash flows not the accounting steady-state NOPAT used in ROIC.
As the network density continues to solidify, and growth CAPEX is depreciated, along with favorable supplier terms, the returns ORLY (and AZO) generate from their investments continue to compound.
ORLY’s successful expansion has yielded exceptionally strong returns, driven by favorable working capital dynamics, rational industry pricing (with visibility on profit margins), increased ticket counts (gains in market share supported by high service levels and inventory availability), and low maintenance CAPEX. We estimate underlying CAPEX—encompassing store fleet replacement and upgrades, equipment and fixture replacements in owned properties, and store remodeling and relocations—to be approximately 7-8% of EBITDA, or 2% of revenues.
One of the key reasons we favor ORLY’s economics is its negative working capital structure and industry-leading comparable store sales growth. As ORLY’s footprint expands, with mid-single-digit comps, we’ve observed that a strong inflow of working capital is financing either buybacks or CAPEX, depending on the perspective. This has led to effective cash returns that are even more favorable than the theoretical ROIIC, especially in the post-COVID environment.
The non-cash depreciation of one-time growth CAPEX and future sales volume growth, which leads to cash inflows from working capital, support ORLY’s strategic shift toward owning properties rather than leasing them, contingent on the availability of attractive opportunities in the marketplace.
As CFO Jeremy Fletcher stated early 2024:
We have always had a preference or a bias towards owned properties. We feel like that long-term investment and our ability to get compounding returns out of an increasing store bases is an attractive part of how we are able to deploy capital for our shareholders, invest back in our business. And we have spoken kind of, over the long course of time, especially as we move to sort of our current capital structure in 2011 and started to dial up our share buyback, we have been consistent around how we think about the prioritization of our use of capital. And the first part of that’s always been within our existing operations and how we think about funding the things that are going to make our existing stores be better. And then as we focus on growth, we know that, that’s been a very valuable engine for a long course of time for our shareholders. That’s always been tempered a little bit by what are the best opportunities and things that are available within our market. And so we have always had a balance. As we work through the last few years, we have seen the economics on those investments improve really on both sides. But for sure, as we own those properties and the per store volumes and our profitability per store have improved, there is and even I think more powerful value creation mechanism there as we invest in owned stores, and I think that’s helped. I think there has also been an ability to identify those properties within the marketplace that has been a little bit easier.
But for us, for this year, we would expect instead of being around 40% of owned new stores in our mix to be closer to 60% for the year and feel like that that’s a positive thing. - Q4 2023 conference call
Cadence in Growth CAPEX
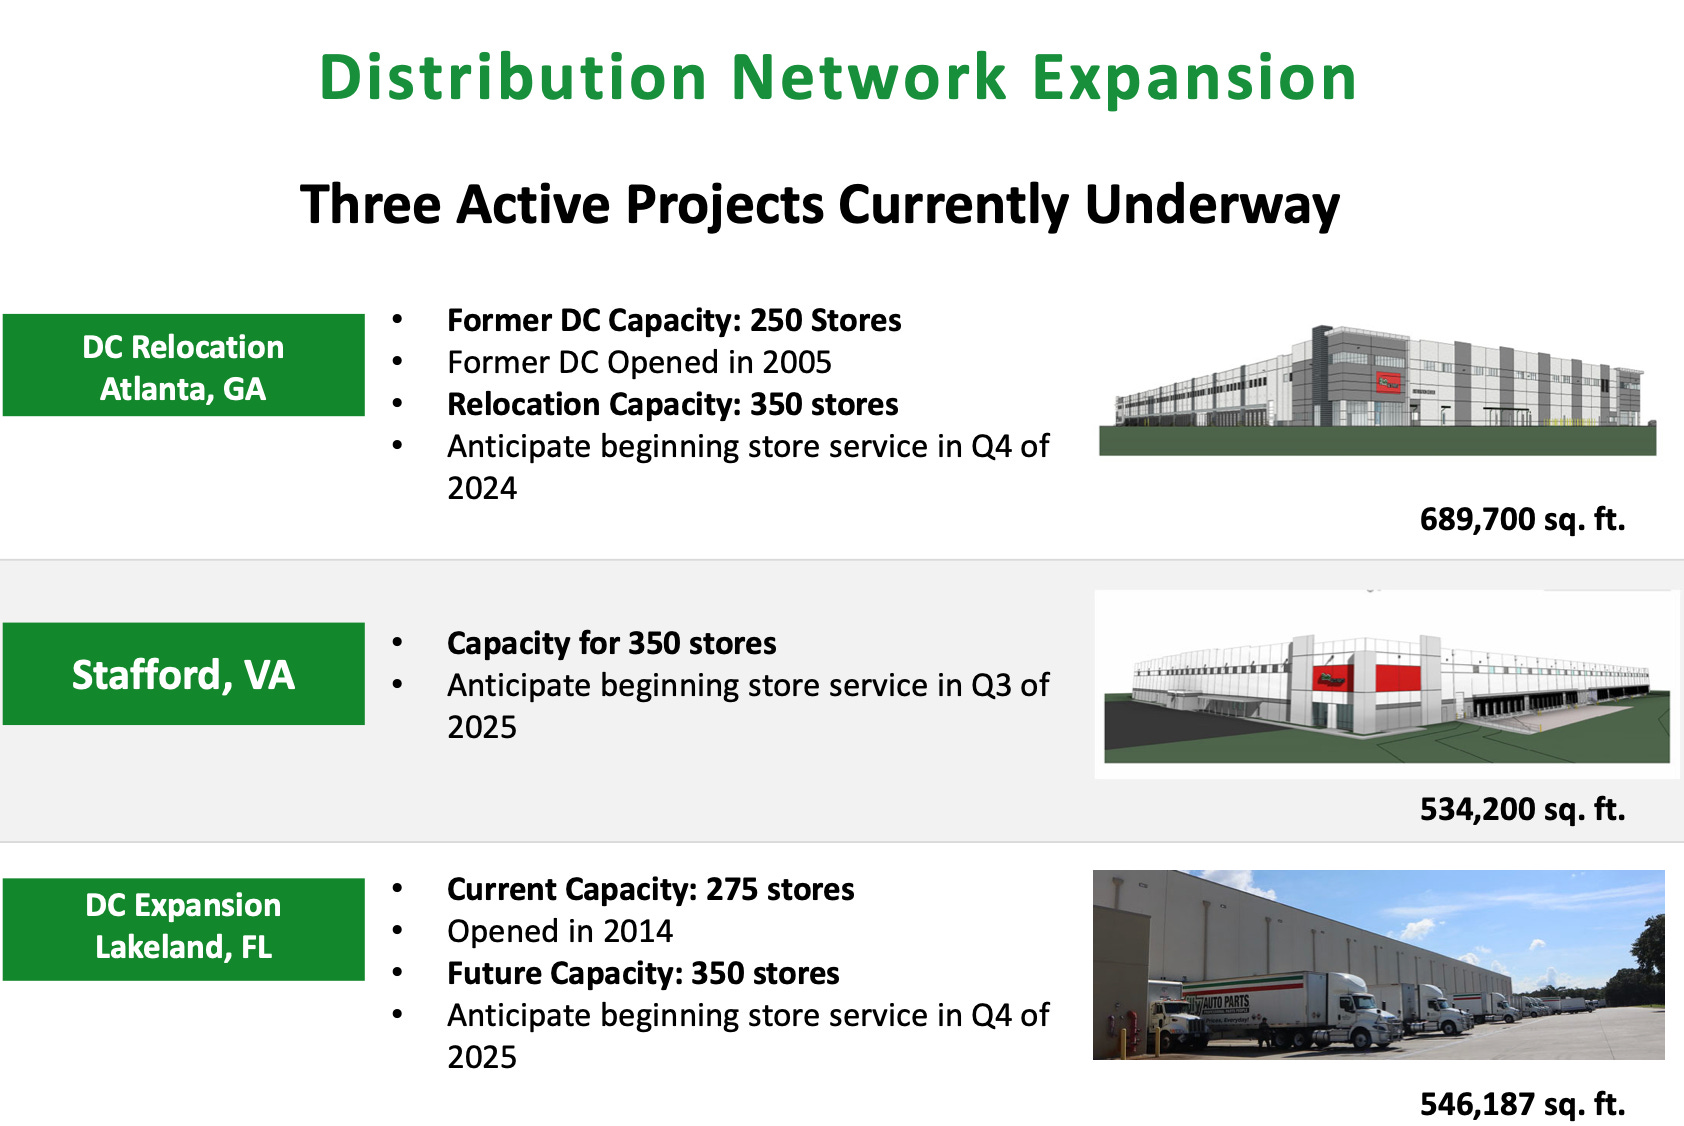
On the topic of cadence in growth CAPEX and when they contribute to the top line, the following commentary from current President Kirby highlights why it’s (or can be) difficult to model growth CAPEX under a traditional ROIIC framework. It’s not that an investment in a 530k square feet distribution center will be able to hit the mid-twenties percent ROIIC instantaneously.
Next we have an exciting distribution expansion project that is in progress in Stafford Virginia where we have purchased a site and began construction on a large new distribution facility that will service the Washington DC, Maryland and Virginia corridor. The new DC will be approximately 530,000 square feet and our initial plan is to build that capacity to service 350 stores. We anticipate this distribution center will be open and operational by the middle of 2025 and we could not be more excited about the store development opportunity this provides us in what is largely an untapped market area for O’Reilly today. - Q3 2023 conference call - Brent Kirby
Exhibit XII - O’Reilly
Non-Cash Headwinds to EBIT Margin
The CAPEX for this new distribution center, which is initially planned to service 350 stores (approximately 6% of ORLY’s current domestic store count), should be considered quite substantial. It’s expected to become operational by next summer, meaning there could be a lag of up to one and a half years between recording this CAPEX and when the new infrastructure starts contributing to the P&L effectively.
Our capital expenditures for 2023 were just over $1 billion, which exceeded the guidance range we updated on last quarter’s call and is approximately $200 million above our initial guidance for the year. As we progressed through 2023, we realized incremental opportunities to further invest in our store and distribution network as well as accelerate our spend on certain initiatives to refresh our vehicle fleet and enhance our store image and appearance. - Q4 2023 conference call - Brent Kirby
While the CAPEX for DCs under construction won’t get depreciated until they’re ready to operate, they do add net positive invested capital to the balance sheet that - at least for now - depresses the reported ROIC figures. And once these assets under construction get transferred to depreciable PP&E, there are some puts and takes as it relates to incremental pressure on EBIT margin. However, there’s no impact on cash flow as it’s a non-cash charge on one-off growth CAPEX, i.e. after the DC is built, there aren’t much maintenance CAPEX.
Part of our anticipated increase in 2024 SG&A expense is driven by a year-over-year increase in depreciation expense directly related to our increased CapEx spend in both 2023 and 2024. As we calendar past our prior year investments, this headwind will moderate as we move through 2024, especially as our mix of capital spending in 2024 shifts more towards new store investments. - Q4 2023 conference call - COO Brent Kirby
As we discussed in our Q2 2024 review:
On the SG&A side, we have to distinct true cash expenses from increased non-cash depreciation related to one-time growth CAPEX (primarily DC development, also store expansion (which is a mixture of owned and leased properties). Indeed, D&A rose 16.3% year-over-year. This notable acceleration in growth CAPEX over the past year resulted in an EBIT headwind of 25m USD to Q2 performance (or 2.9% of Q2 2023 EBIT).
As such, it is entirely possible—and even expected after periods of high sales growth—to see an accelerated investment pace with a lagged effect on EBIT growth, as the incremental sales may not immediately offset the pressure of non-cash depreciation.
This is one of the reasons we are cautious about providing quarterly guidance on ORLY’s performance. We believe it’s more relevant to take a step back and focus on broader trends such as gross margin, core SG&A growth per store, working capital dynamics, market share, and other key factors.
Part IV - Recent Financial Performance
Nevertheless, it’s important to look at the recent quarterly trends from a relative competitive point of view, especially as many retailers haven’t fared well since the beginning of 2022 amidst higher inflation, consumers trading down, traffic/ticket count pressure, tougher expense control, and lapping COVID-19 tailwinds.
Profitability
Starting with profitability, exhibit XIII shows the progression of gross margin, OPEX/SG&A, and DIFM as % of total sales. We’ve disaggregated the recent performance in four time periods.
Exhibit XIII - The Compounding Tortoise
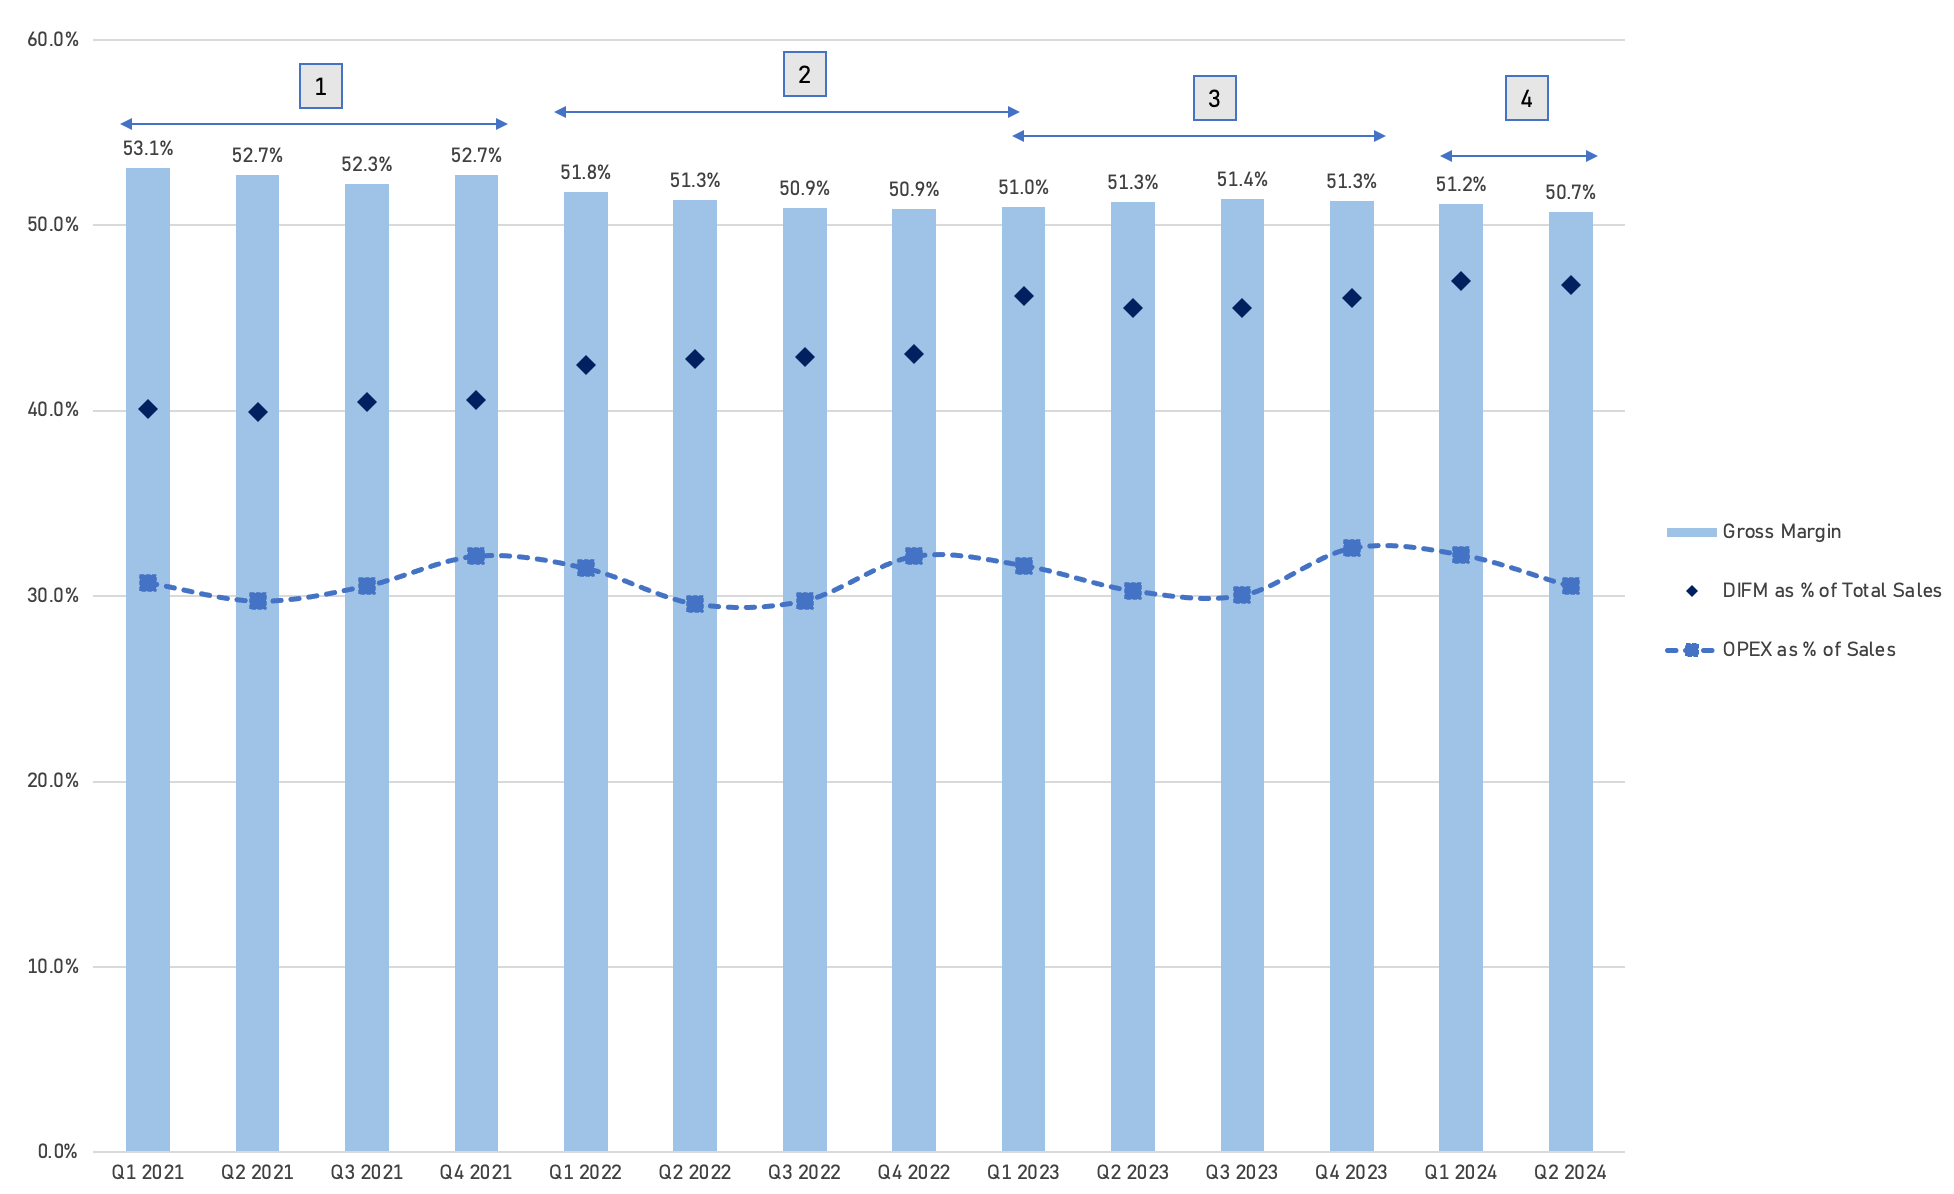
(1) LIFO Comparisons
ORLY benefited from LIFO accounting as it relates to the sell-through of lower-cost inventory. Specifically, it had a 43m USD positive LIFO impact in Q3 2021, compared to no significant benefit in Q3 2020. This positive LIFO impact was directly related to the reversal of its historic LIFO debit balance.
To explain further, since 2013, ORLY experienced negotiated decreases in acquisition prices, which caused its LIFO inventory balances to exceed the replacement cost of its inventory. Management took a conservative approach by choosing not to write up the inventory value beyond its replacement cost.
Consequently, as costs and prices rose during 2021 and 2022, ORLY’s margin benefited from selling lower-cost inventory that was acquired before these increases. However, this situation shifted in the third quarter of 2021, when inflation and rising acquisition costs caused its LIFO reserve to revert to a credit balance, marking a return to typical LIFO accounting, where ORLY no longer saw the same level of benefit from lower-cost inventory sell-through, but instead, reflected current acquisition costs in its reported results.
As a reminder, ORLY doesn’t view LIFO as a discrete charge to its gross margin, and so it didn’t record non-cash charges during FY22 and FY23.
(2) Broad-Based Inflation & PPI (Pro-Pricing Initiative)
Inflation picked up notably during 2022, and with slower-turning inventory (1.7x), higher product costs—including inventorial freight costs—had a negative impact on gross margin. Another factor that contributed to the lower gross margin was the faster growth in DIFM, which was partly driven by the pro-pricing initiative. In simple terms, this involved strategic price adjustments (aka price investments).
It truly is a combination of strong customer relationships, excellent customer service and industry-leading inventory availability, coupled with our more competitive pricing, which drives the superior value proposition we provide to our professional customers. Simply put, the best overall value in the aftermarket has gotten even better. - Q2 2022 conference call
While the pricing initiative was targeted, well-thought-out, and tested on a selected number of SKUs rather than the entire product range, announcing such a strategy to gain market share could potentially trigger a domino effect, leading peers to implement their own reduced pricing strategies.
Obviously, that would just create a race to the bottom in retail, which is not something we want. We feel like we’re competitively priced for our DIY and our DIFM customers. We commented on the DIFM price adjustments. And while we’re constantly monitoring and adjusting prices on both sides of our business, that one really philosophy change that we made earlier in the year was a onetime event on the DIFM side, and we have not had any consideration of making any type of mass change to the DIY side or retail side of our pricing. - Q2 2022 conference call
However, ORLY didn’t see much reaction from its competitors, and in fact, it was AZO that started out with some small changes to the DIY and DIFM side early 2021.
(3) Catch-Up in SG&A per Store Growth
Following COVID-19, many companies experienced strong margin expansion due to the postponement of certain cost increases, and very strong demand resulting in higher economies of scale. During 2022, ORLY did see a more normalized growth rate in SG&A. For instance, during Q4, the increase in SG&A expenses included a 28m USD charge associated with our transition to an enhanced paid time-off program for its team member.
We don't just look at one quarter. We look at long periods of time, the way we manage store staffing, for example, and the last few years, as you know, quite frankly, we weren't happy to O'Reilly with our turnover and retention numbers in the stores. It was just subpar. We feel like we held up better than most in retail and our direct competitors. But we weren't happy internally with our turnover and retention numbers. And it took some time for us to overcome that. And when I think of really what the teams have done, what Jason and the teams in the back have done this year with store staffing, store payroll, is really, I think, what we're seeing. It's not like all of a sudden, we're not spending this year.
I think we're continuing to invest in the right strategic initiatives. But we have seen fruits from slowing down that turnover, getting back to O'Reilly standards on store turnover retention, DC turnover and retention. And so we're seeing some payoff in those things that Brent talked about earlier with what we did with PTO, what we did with our store manager work schedule, we made their work schedule a little more conducive to work-life balance while still doing the job they need to do. And so really managing the expense well, but continuing to invest. - CEO Brad Beckham
Then in 2023, the expected increase in SG&A per store was projected to be +4.5% but ended up at +7%, driven by better comparable sales performance, more D&A (driven by higher CapEx spend), and a continued catch-up in expense growth that wasn’t realized during the pandemic years.
At the same time, ORLY has proven its ability to judiciously manage expenses in line with overall sales growth, and to scale back when the environment dictates.
On an average per store basis, our SG&A grew 2.8% in the second quarter with approximately 10 basis points of that growth driven by the inclusion of Canada's operating results. Our SG&A spend was below our original outlook for the second quarter as our teams effectively balanced our unwavering commitment to deliver industry-leading customer service while also prudently dialing in the appropriate staffing levels to match our business. - Q2 2024 Brent Kirby
(4) Del Vasto Acquisition
Late last year, ORLY made the announcement to acquire Group Del Vasto, which got consolidated late January of this year for a total cash consideration of 155m USD. Note that we don’t have the exact info on any acquired net debt (incl. lease liabilities).
The company, headquartered in Montreal, Quebec, Canada, operates as Vast-Auto Distribution. Founded over 35 years ago, Vast-Auto is a well-respected, family-owned business with a strong company culture built on the core values of hard work and exceptional customer service. They currently manage two distribution centers and six satellite warehouses, supporting 23 company-owned stores, a network of strategic independent partners, and thousands of professional customers across Eastern Canada.
The purchase price allocation process for the Del Vasto acquisition, which is still ongoing as of today, involves gathering data to accurately value the assets acquired and liabilities assumed in the business combination. ORLY has largely completed the allocation for working capital items, such as inventory, accounts receivable, accounts payable, and property, plant, and equipment. However, the evaluation of potential identifiable intangible assets, including trade names, trademarks, non-compete agreements, and customer relationships, is still in progress. Other assets, such as internal use software, and additional assumed liabilities may also be identified and valued. As such, the purchase price allocation remains provisional and is subject to change as more information is obtained and valuation efforts are completed during the initial measurement period. The preliminary assessment has resulted in the initial recognition of 109.8m USD in goodwill and intangible assets, including the impact of deferred taxes related to the acquisition.
Given Del Vasto’s mix of lower margin distribution business to independent parts stores, ORLY expects a 30 bps headwind to gross margin, and a 15 bps dilution on EBIT. We estimate FY sales for the acquired target to be around 130-135m USD (0.8% impact to ORLY’s FY23 sales) with no meaningful EBIT (0-2m USD). However, we see tremendous synergy potential on the supply chain side (Del Vasto has a 14-16% gross margin), and believe the acquisition is the first step in building out sufficient scale in Canada.
On Canada, and then I'll turn it over to Jeremy from the kind of the economics Canada is very similar, obviously, to a lesser degree than Mexico in terms of the TAM. Canada is, as everybody knows, is the population sits on the US border. And so there's still a lot to learn about what exactly our distribution network is going to look like. But very similar to Mayasa is we wanted the right people platform in the Canadian market. It's a decent DIY market. It's a phenomenal DIFM market. And we wanted, again, the right people platform, not only that understood the Canadian market, but specifically understood the Quebec market in French Canada. And we absolutely have that in Mauro Cifelli and the team that's running that business for us. We've known them for a long time. They're kind of an industry icon as a family and as a team. They're a great company there with Groupe Del Vasto -- and so we still -- it's still a little bit early to say exactly what our plans are going to be in Canada, but they had distribution capabilities, both in Montreal and Toronto as well as kind of what we consider hub stores they had as well. And so we have a lot of capabilities in place. We're going to be working on those plans the next year to really figure out what that store ramp needs to look like and what it will look like in terms of actually being branded O'Reilly. So more to come on that. - CEO Brad Beckham during 2024 Analyst Day
If ORLY manages to improve Del Vasto’s gross profitability to 40%, it would imply an after-tax ROI of 17.7%. It also demonstrates why it’s difficult for smaller players to be very profitable on a standalone basis.
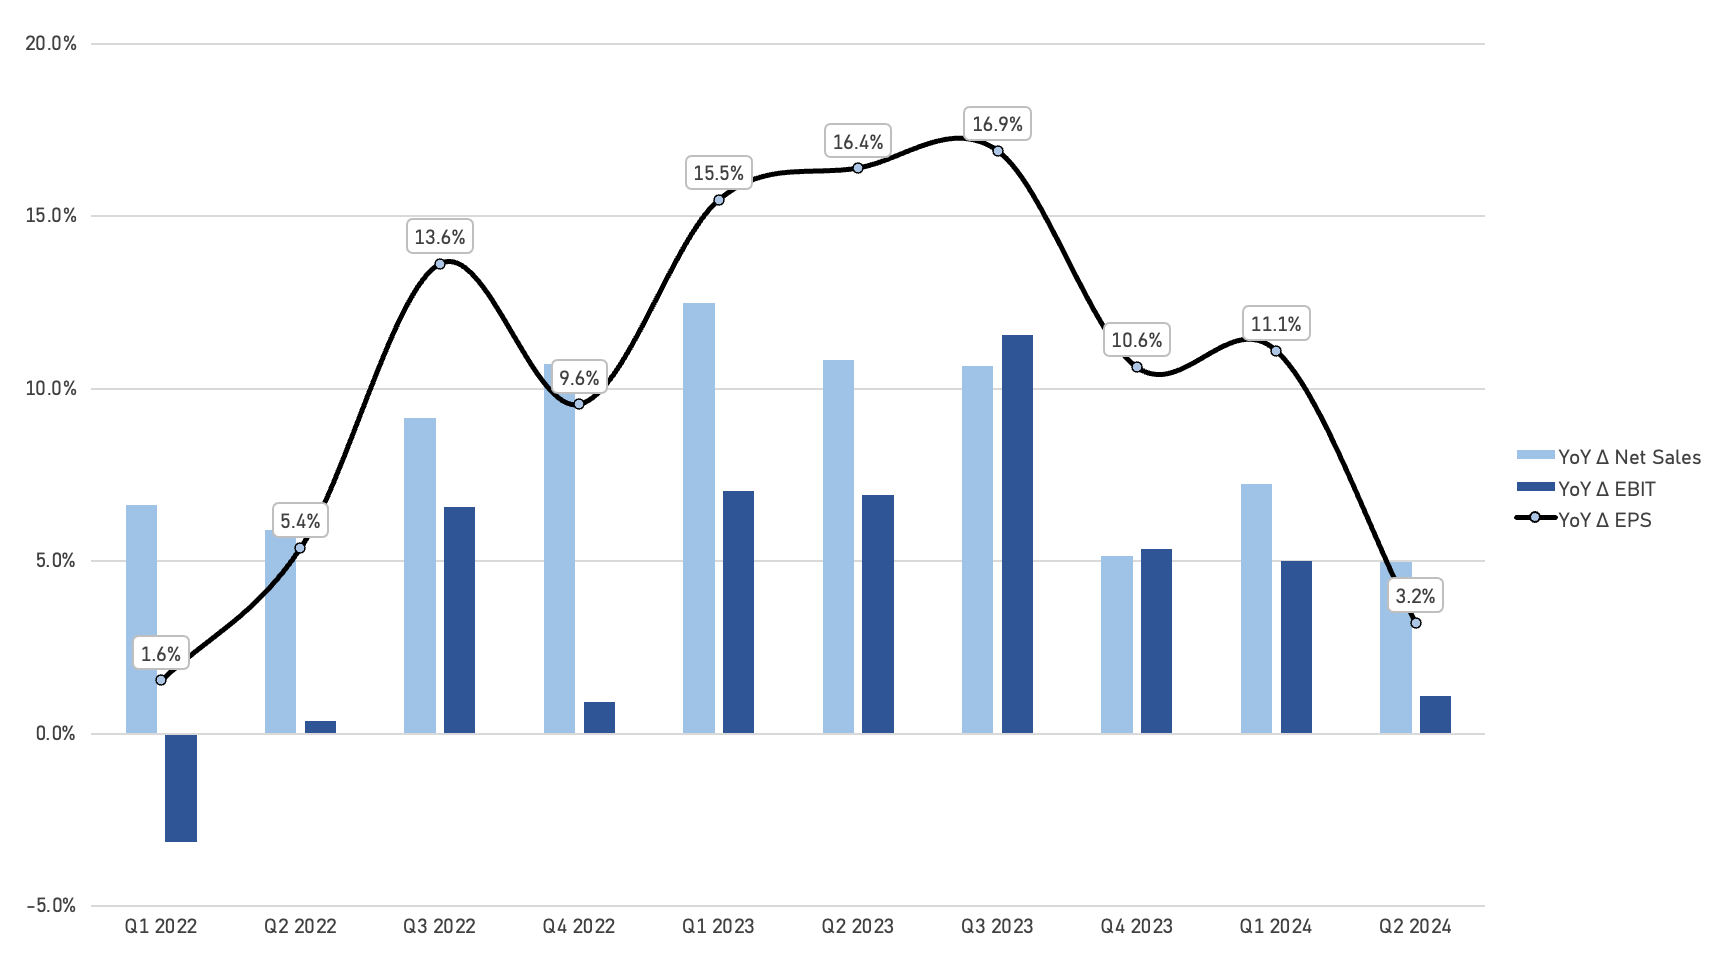
To round off this section on the recent events, and their impact on ORLY’s profitability, exhibit XIV shows the year-over-year increase in net sales, EBIT, and EPS on a reported basis (thus not corrected for the LIFO comparisons as we did for AZO).
Exhibit XIV - The Compounding Tortoise
Same-Store Sales Growth
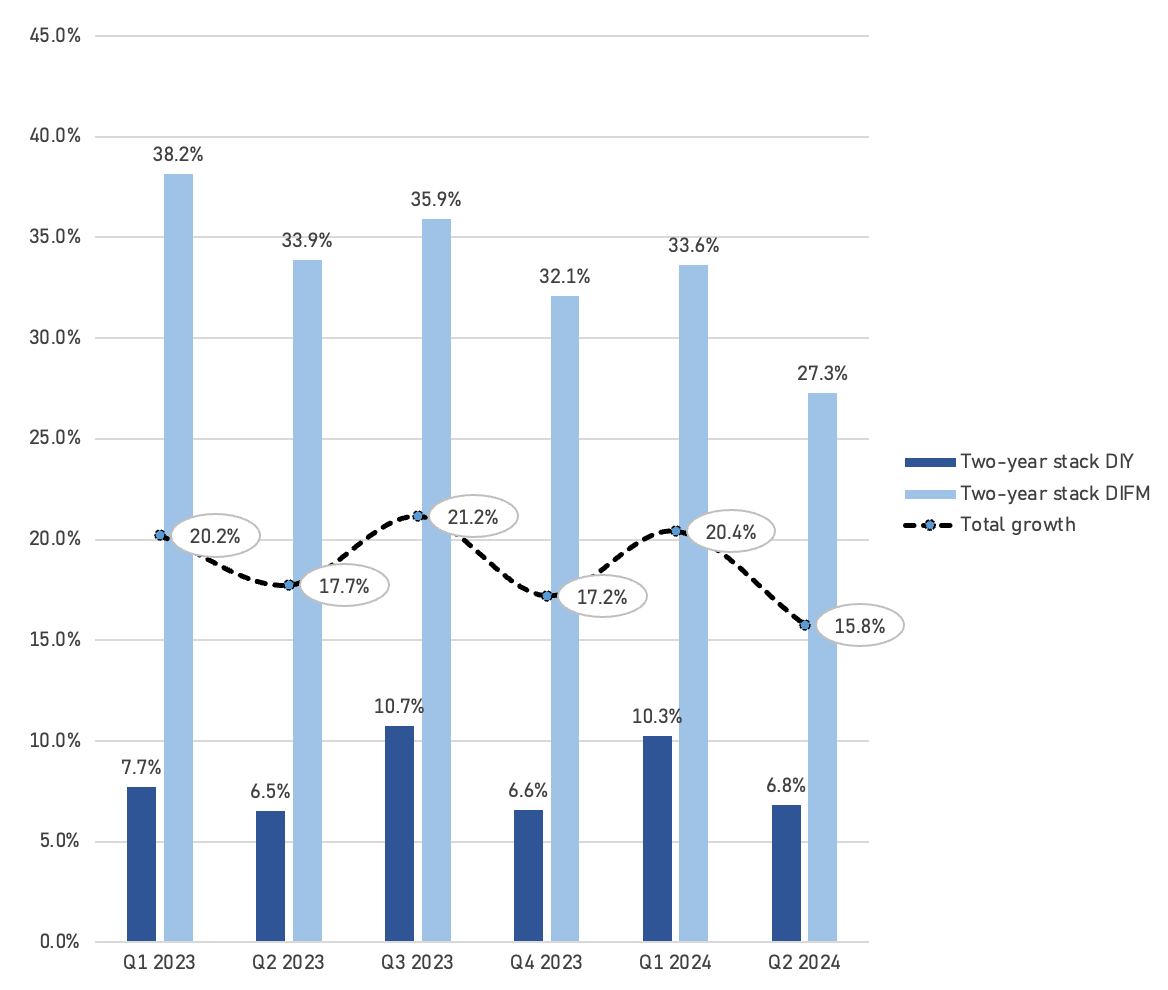
While ORLY’s growth rates have come down, we encourage investors to look at the two-year stacks (compounded) to gauge momentum relative to the industry, and to account for the high inflation comparisons of 2021, 2022 and 2023.
Exhibit XV - The Compounding Tortoise
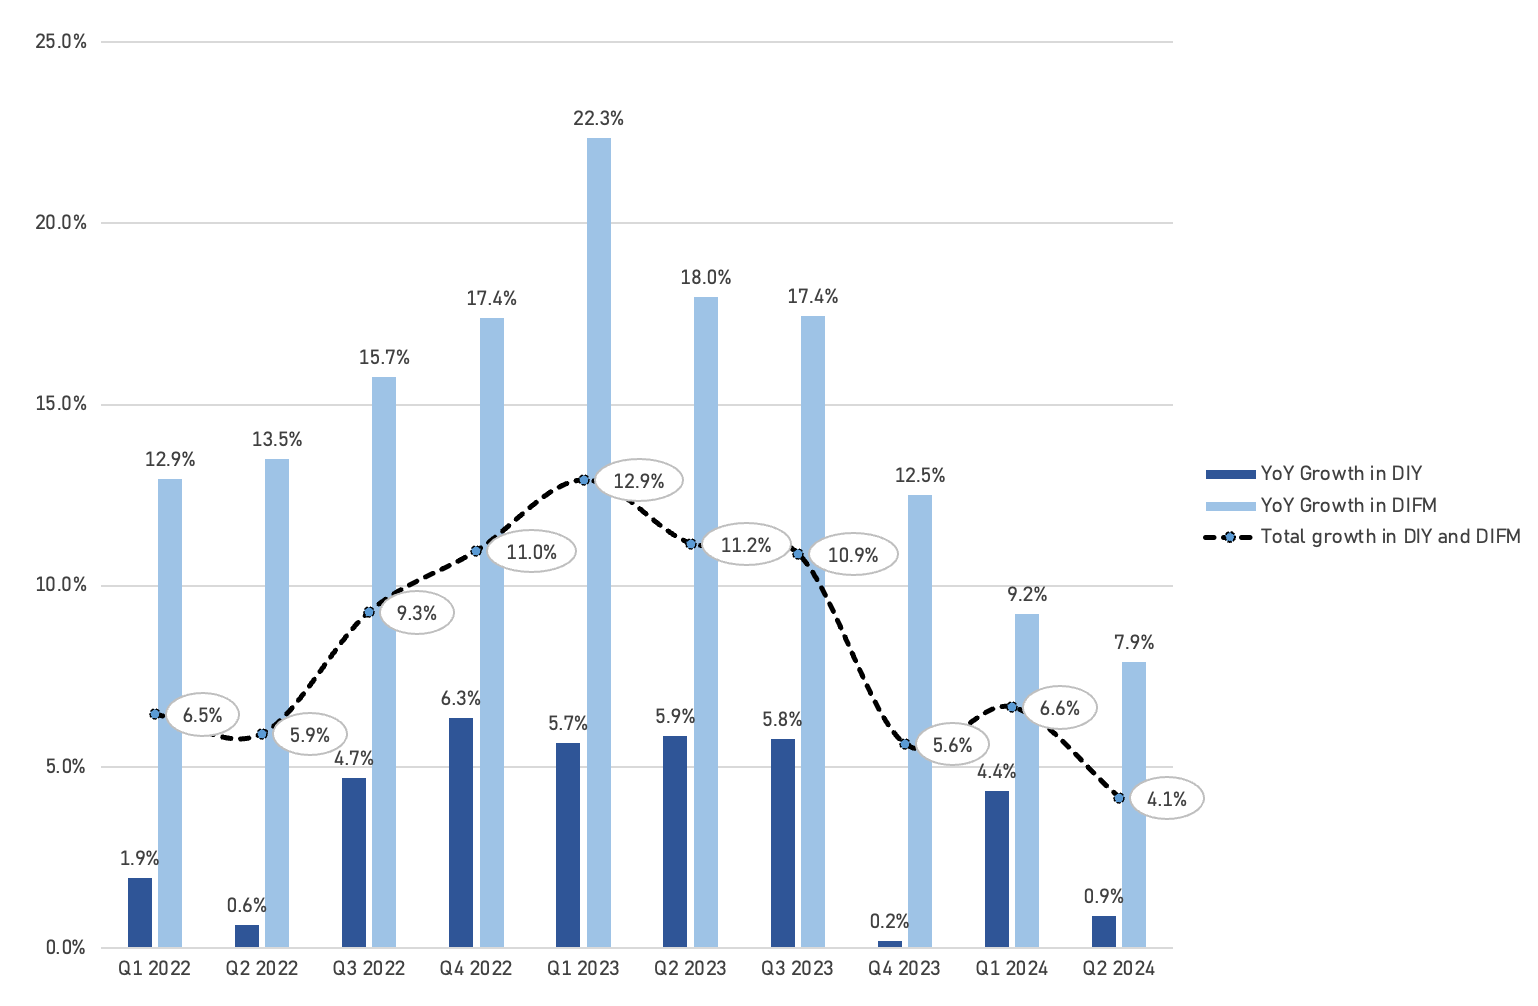
On a two-year stack basis, DIFM’s high-30% growth has moderated to 27%, driven by normalizing same-SKU inflation and the fact that ORLY’s professional sales have grown significantly. With ORLY now operating from a much larger base, the absolute dollar amount of market share gains remains strong, but the relative/percentage growth is lower.
On the DIY side, we've moved past some substantial pricing tailwinds, and demand for discretionary items (such as accessories, chemicals, and appearance products) has normalized. Overall, we believe ORLY has gained and continues to gain significant market share across both segments of the business.
Exhibit XVI - The Compounding Tortoise
Inventory and Leverage
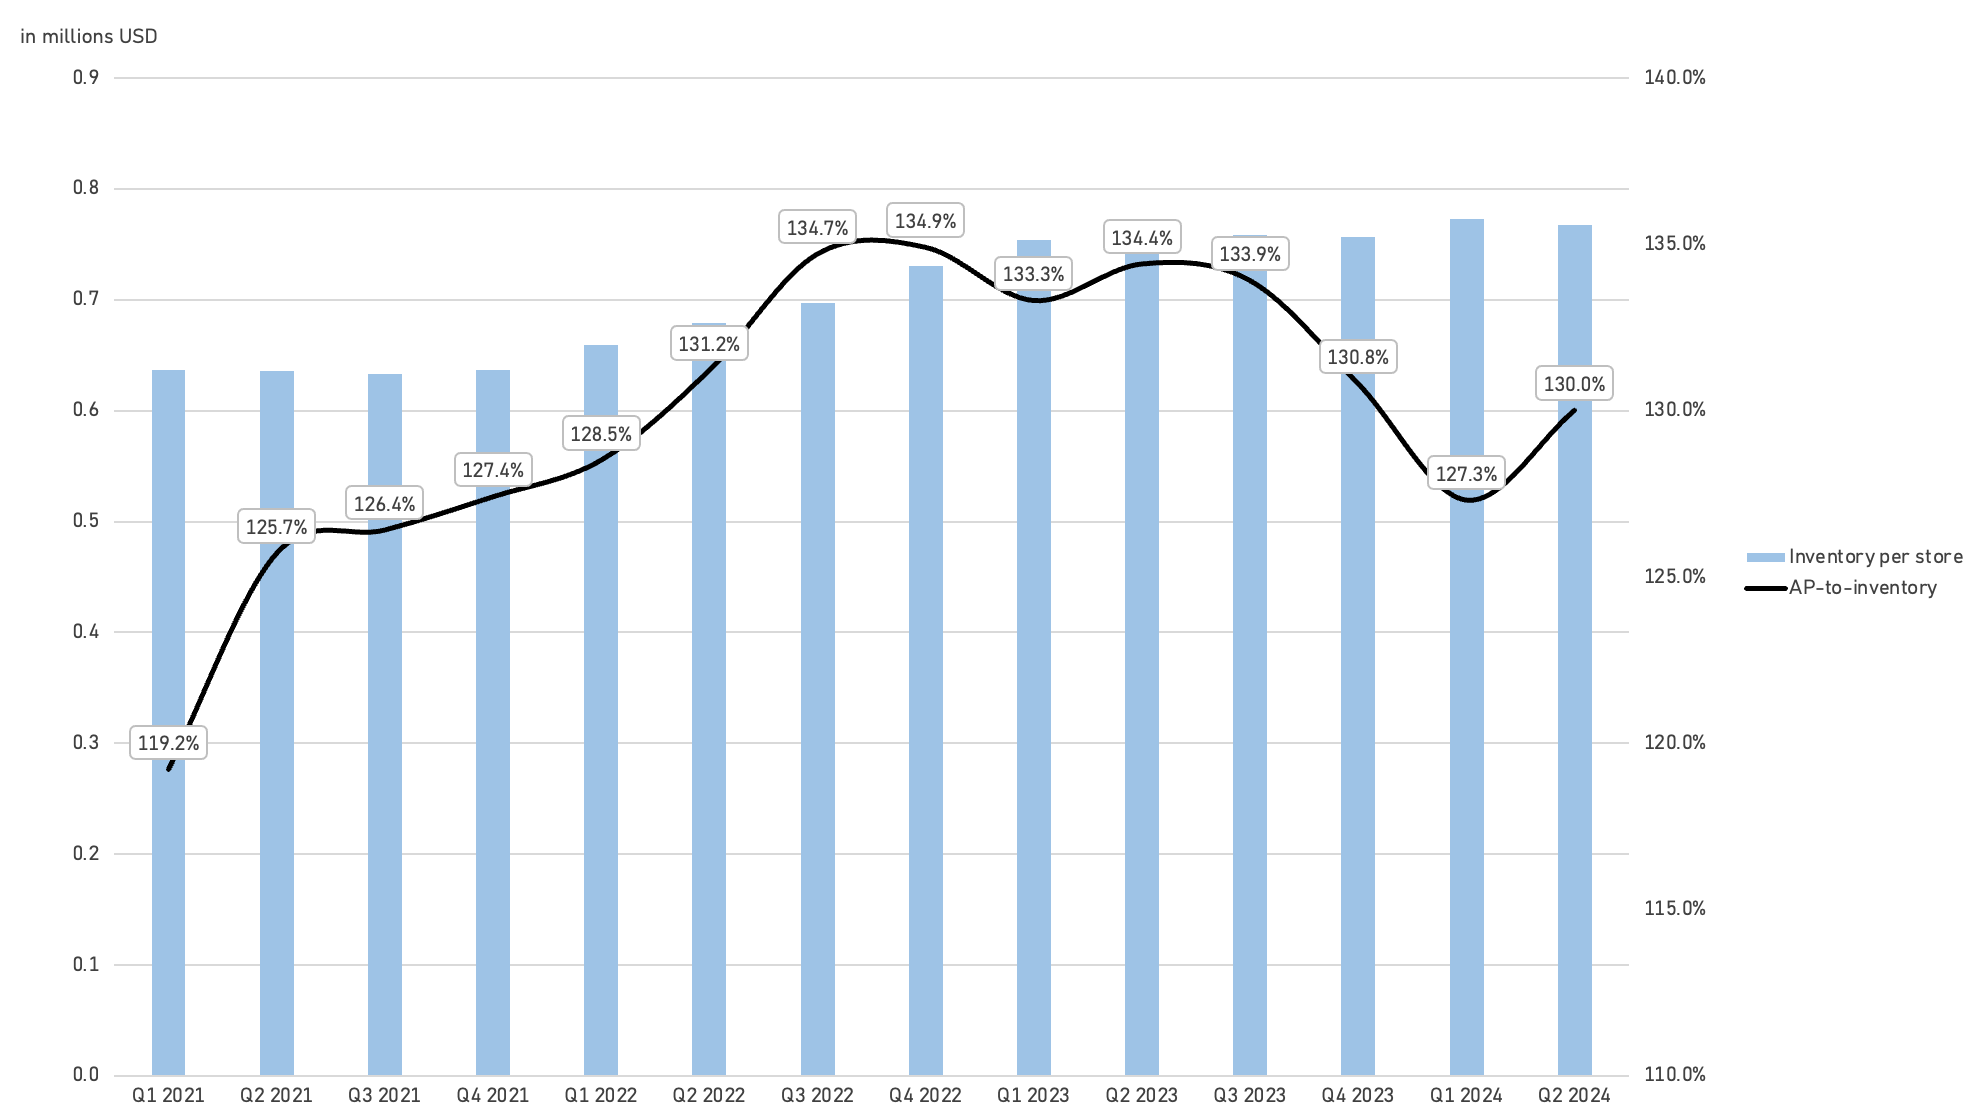
Moving onto inventory and leverage. ORLY’s net inventory level has turned more negative due to a higher AP-to-inventory ratio, new store openings and mid-single-digit same-SKU inflation.
Compared to AZO, we’ve observed better performance in accounts payable for ORLY recently. While AZO’s differing quarterly reporting periods make direct comparisons challenging, we believe ORLY’s industry-leading performance in ticket counts (i.e., handling higher volumes) and the growth of its proprietary brands are the primary drivers behind its strong net inventory performance.
Exhibit XVII - The Compounding Tortoise
On the leverage side, ORLY hasn’t levered up relative to AZO (which is now at 2.4-2.5x EBITDAR, and that’s helped its EPS growth). As such, there’s more headroom to spending on CAPEX/making strategic investments, and repurchasing stock. At the same time, EBITDAR has grown by 5.9% since Q1 2021 despite the incremental margin pressure we’ve addressed in the above section. Overall, we believe an annual increase in EBITDAR of around 8% beyond FY24 is feasible.
Exhibit XVIII - The Compounding Tortoise
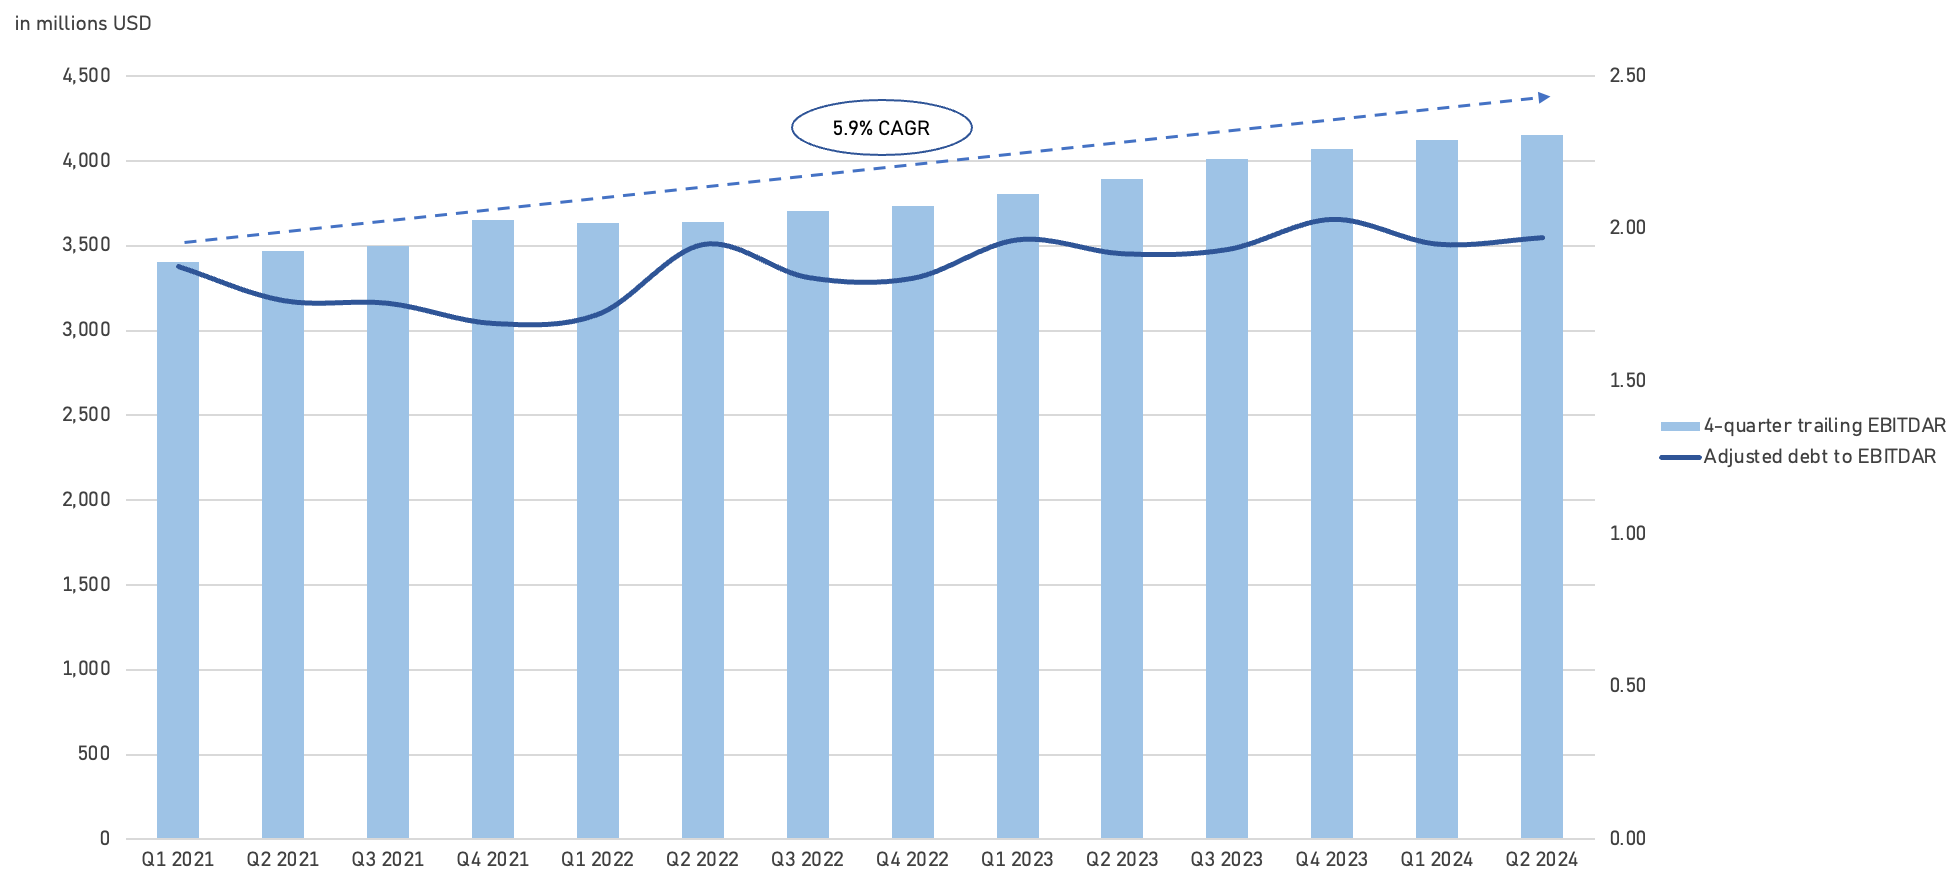
Given that ORLY is now comfortably below the upper end of its investment-grade credit leverage ratio, some analysts have started to question whether 2x has become the new norm. CFO Jeremey Fletcher recently declared.
So no, we wouldn't say that we've reestablished a new target. It's probably been more than two Analyst Days that we've been below our level candidly. Our focus there same as it's been over - really, gosh, the last 13, 14 years that we've been under this capital policy. We want to be prudent and consistent about how we might move to that target over the course of time.
We constantly reevaluate that, but we still think that's the right mix for our business. I think I had a question maybe before we started today, just as we were milling about how do we think about what our capacity is to be able to invest. And we feel very comfortable where we're at today and at our leverage target that we've got a balance sheet that allows us to take advantage of any strategic opportunities that we would see and feel very comfortable over the course of time as we gravitate towards that level that, that will remain true. - August 2024 Analyst Day
Cash Flows and Share Repurchase Program
The favorable net inventory position is also being reflected in the steady cash inflows from core working capital. Other working capital items include income taxes payable, accrued accounts, and other operating assets/liabilities. Exhibit XIX gives an overview of the quarterly cash flows.
Exhibit XIX - The Compounding Tortoise
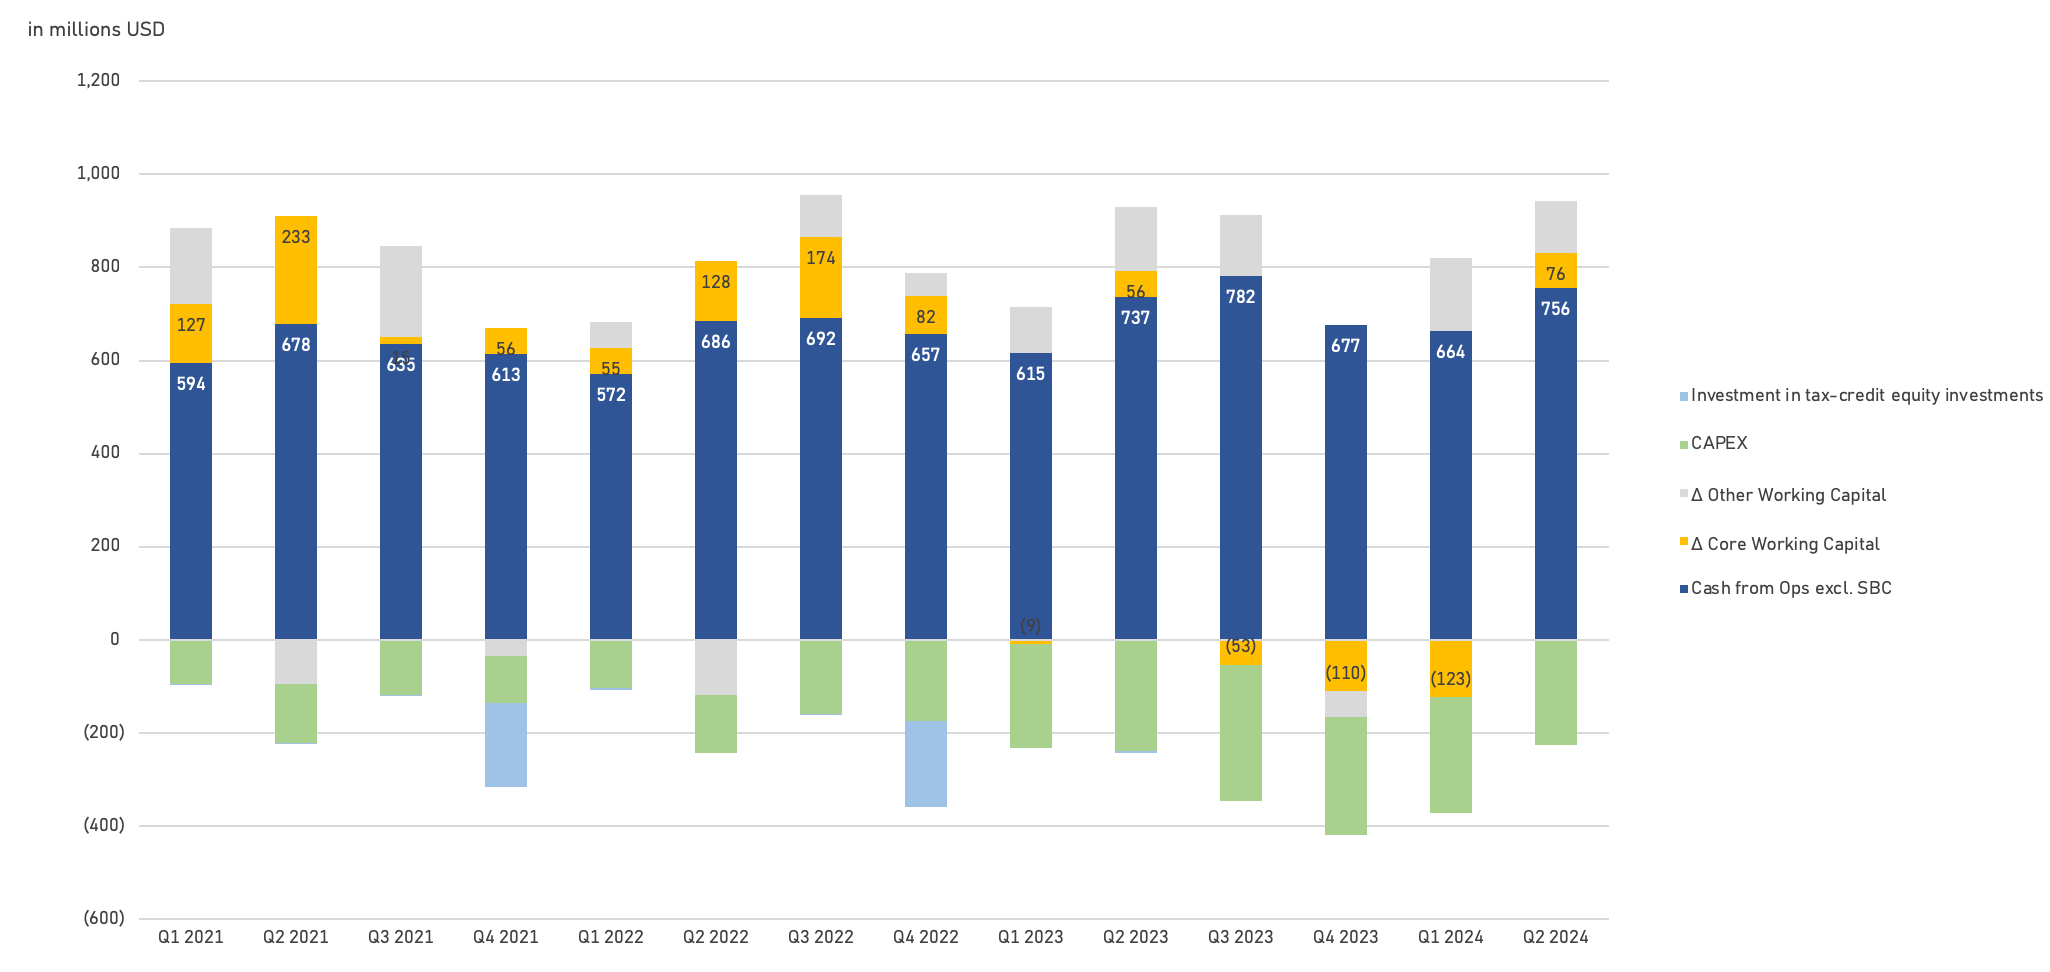
On the tax credit equity investments: ORLY invests in specific tax credit funds that support renewable energy initiatives. These investments yield returns primarily through the realization of federal tax credits and other related benefits. It applies the deferral method to account for the tax attributes of its renewable energy investments. This approach recognizes realized investment tax credits and other benefits as a reduction in the carrying amount of the renewable energy investments.
All of these benefits were realized through reductions in cash income taxes paid and are reflected as part of the changes in "Income taxes payable" in the cash flow statement (i.e. other working capital). ORLY’s maximum potential loss exposure related to these Variable Interest Entities (VIEs) is generally limited to its net investment, which was 34.7m USD at the end of 2023 (reported under “Other assets, net”).
Put simply, cash inflows from other working capital related to income taxes payable tend to be offset by these tax credit equity investments. Net net, there’s not much of an impact on free cash flow. The same is true for AZO.
Exhibit XX highlights free cash flow and the executed share repurchases.
Note: free cash flow calculated as cash flow from operations excluding share-based compensation (i.e. treating it as a cash expense) minus CAPEX, minus tax credit equity investments. Keep in mind that an increase in operating lease assets (excluding the effects of M&A) should be treated as CAPEX (not shown in the below graph), as they are an integral part of invested capital and thus influence ROIC.
Exhibit XX - The Compounding Tortoise
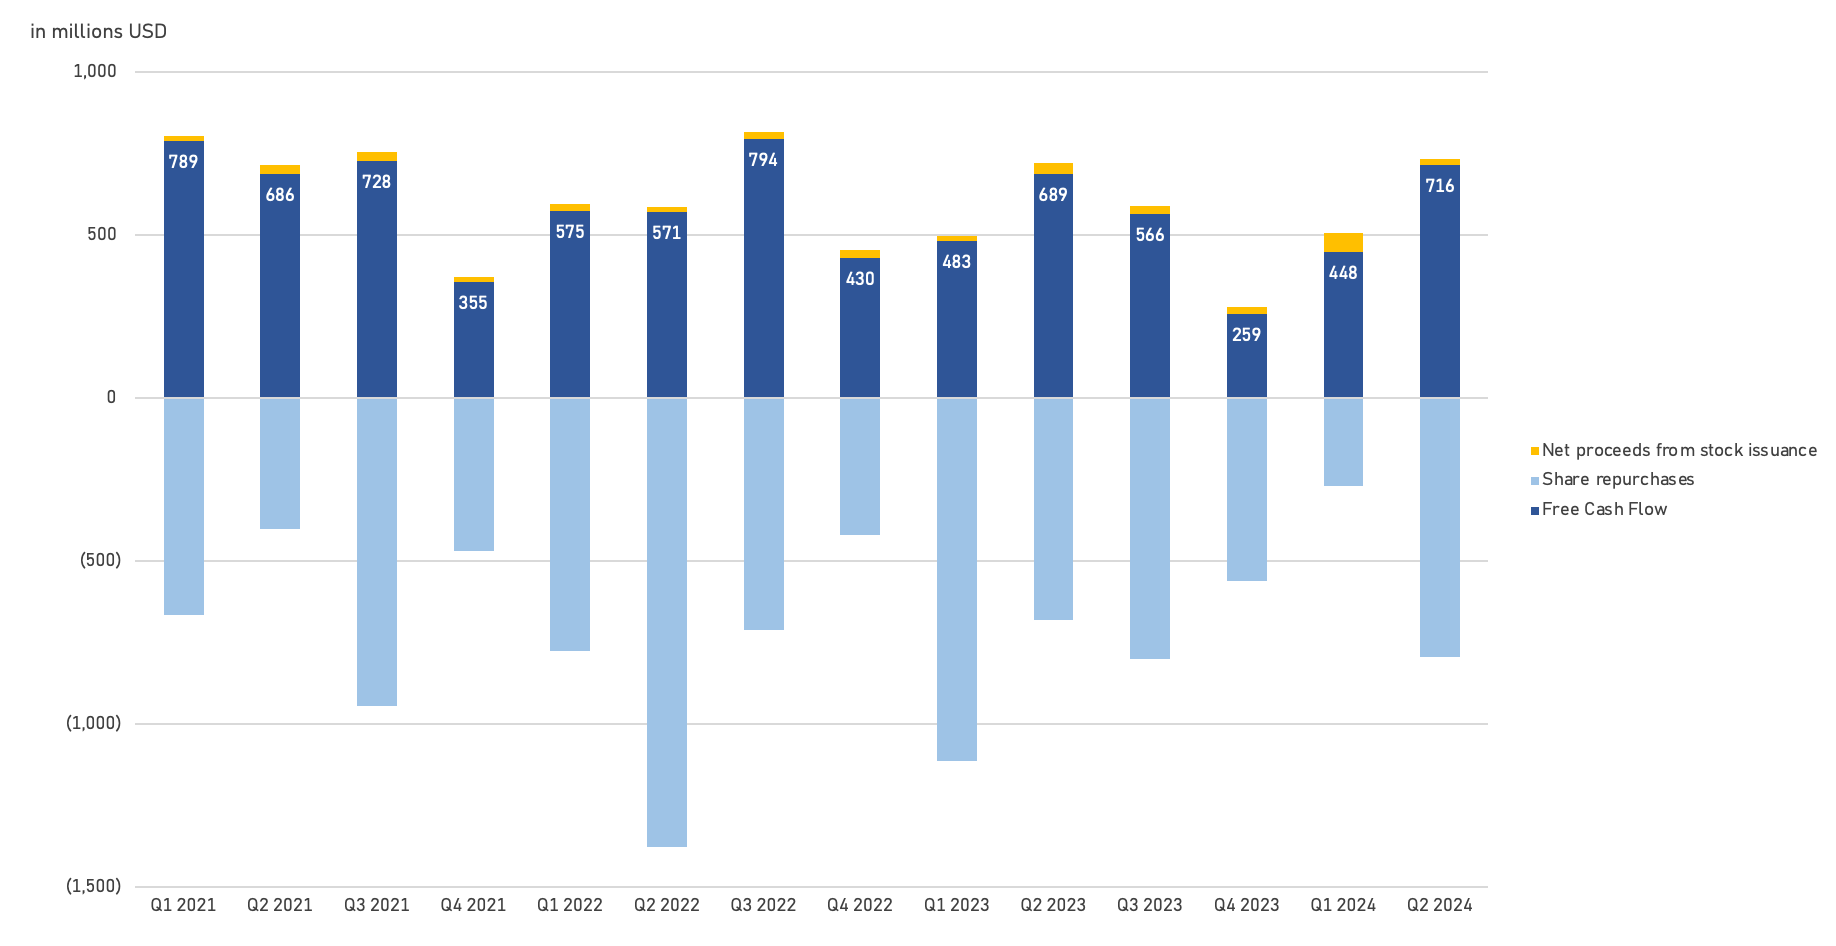
Similar to AZO, ORLY has an ongoing share buyback program that started early 2011. Initially, ORLY prioritized its reinvestment potential, did some strategic M&A (as highlighted above), and then started doing buybacks to allocate excess capital in tax-efficient manner.
It's important to emphasize that the top priority—reinvesting in the business—remains unchanged. Buybacks are therefore a byproduct of excess capital, and management isn't committed to a specific target. Additionally, we appreciate the philosophy of being more aggressive with buybacks when the valuation becomes increasingly compelling. For investors taking advantage of a dip, this approach offers a valuable opportunity to achieve above-average IRRs.
From a repurchase perspective, we continue to feel like we utilize our repurchase program as an effective means of returning capital to our shareholders. And I think for us, over the course of time, it has been successful really because it’s been driven by our ability to be both consistent and drive repurchases really month in, month out because of the consistent nature of our cash flows. But then also when we have opportunities to be opportunistic at times. And I think you probably saw some of that in the first half of the year. That philosophy hasn’t changed. We’ll prioritize our capital for reinvestment in our business because we like those returns to the best. But when we have an opportunity, we’ll execute our buyback program with that same philosophy. - Q2 2022 conference call
Part V - Management Team & Expectations Treadmill
A rare interview with CEO Brad Beckham earlier this year revealed the type of mentality we expect from steady compounders: staying low-profile, keeping eye on the ball with industry-leading performance, managing the business for the long run, and maximizing risk-adjusted returns.
Here are some excerpts.
When he reflects on almost three decades with the company, Beckham honors the many people who have impacted his career. “In 1997, I fell in love with the parts business,” he says, “but when I look back, I realize I fell in love with O’Reilly Auto Parts. I went to work with a group of people that cared about Brad as a 17-year-old kid. They put their arms around me; they taught me about the business and about life. I was shy, and veteran parts people brought me out of my shell and taught me how to take care of customers.” Beckham was just 17 years old when he took a job at an O’Reilly Auto Parts store in Wagoner, Oklahoma.
He had graduated from high school only two weeks earlier. “I didn’t think college was for me,” Beckham says, “but I had a ‘68 Camaro and a dirt track car, and I loved DIY projects. O’Reilly had the best parts people, and I assumed it would be a really cool job.” The company typically hired at age 18, but Beckham begged the manager to hire him. His official title was “parts specialist,” although at 17, that really meant sweeping floors and organizing stock.
Once in the role, Beckham was humbled pretty quickly. “I realized I didn’t know as much as I thought I did,” he says. “I started working with veteran parts people and saw how much they knew about cars. I enjoyed the fact that I had so much to learn; it was very motivating to me.” It was so motivating, in fact, that Beckham became the store manager just two years later.
In his mid-20s, he became district manager in Texas and Kentucky, and by the time he was 30, he was a regional manager in Atlanta. From there, Beckham advanced into new responsibilities, finally relocating to Springfield’s corporate headquarters in 2013. During his career, Beckham has been on the front lines of some tough expansion markets.
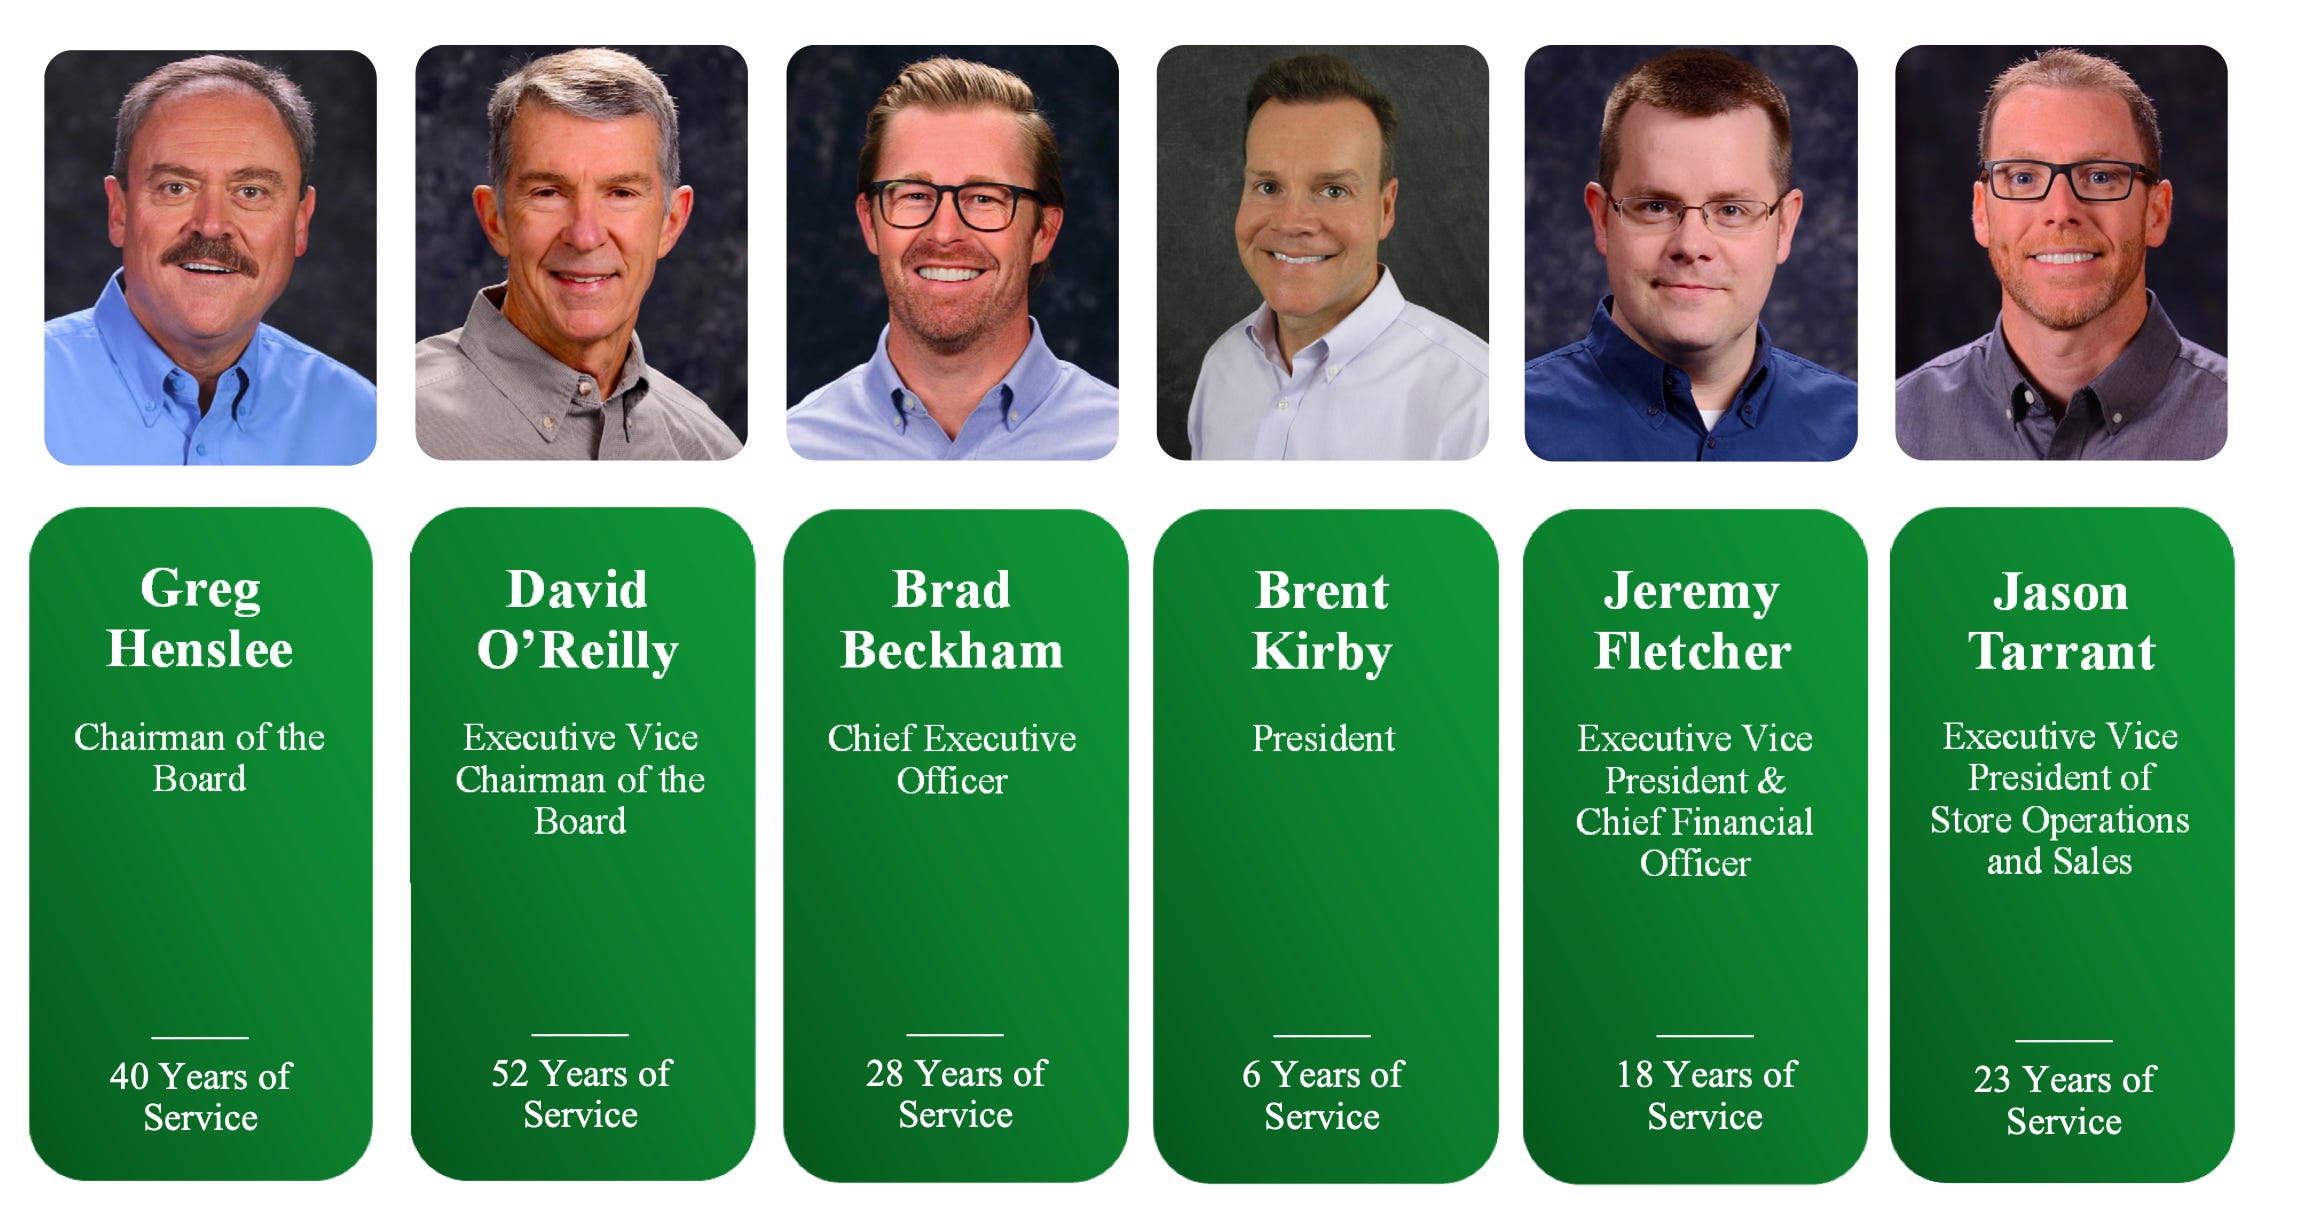
In a competitive industry, he has been savvy at identifying competitors that would be an excellent fit for the company, “putting them in an O’Reilly shirt instead of the one they were wearing,” says Greg Henslee, Chairman of the Board and former CEO. According to Henslee, Beckham has developed a cadre of professional recruiters who are excellent at hiring people who know auto parts and adhere to O’Reilly culture. Over the years, Beckham has tackled significant challenges that have confronted O’Reilly Automotive.
For example, when health care laws changed during the Obama administration, the self-insured company faced unprecedented cost increases. In response, Beckham developed recommendations for increasing the part-time team members in the stores while the company implemented the new health care requirements. Gradually, O’Reilly adapted to the yearly expense, and they were able to increase the full-time roster. “Brad adapts well to adversity,” says Henslee. “He is willing to put a smart team together and develop a strategic plan. Being CEO will be a new test of his skills.”
As Beckham becomes CEO, he is wholly dedicated to realizing O’Reilly’s mission statement, which is “to be the dominant supplier of auto parts in our market areas.” But with O’Reilly Automotive occupying just 10 percent of the total addressable market, there’s plenty of room for growth. Each year for the next five years, the company intends to open 180 to 200 stores, both inside and outside the United States. “We have the reality, not the goal, of being an international company,” says Beckham, who cites potential for expansion in Mexico as well as an ongoing search for strategic acquisitions. The company is part of an industry that Beckham refers to as “recession-proof.”
Yet even as O’Reilly’s executive leadership develops strategic plans, they maintain an underdog mentality: “We want to compete like we are 0 and 6, not 6 and 0, and never take our success for granted,” Beckham says. In a company made of hard work and high expectations, ego takes a backseat.
In our deep dives, we primarily emphasize the quantitative drivers of a proven compounded, but as we’ve stated in several webinars and earlier posts on Substack: everything has to start with industry-leading execution and management integrity. Not every humble manager stays humble when success is being harvested, and one should distinct exceptional management from broad-based industry or macro tailwinds.
Exhibit XXI - O’Reilly
In many ways, both financially and managerially, ORLY’s story parallels AZO’s: you create a successful growth strategy, adapt to a changing competitive and macro environment when necessary, and then stay committed to the game plan. Above all, you take nothing for granted and strive to control your own destiny as much as possible.
With its past success, one could argue that ORLY is more vulnerable to the expectations treadmill. Investors sort of expect the strong streak to continue. The “expectations treadmill” principle shows that a company’s share price is driven more by shifts in market expectations than by its actual performance, such as growth and returns on invested capital. As expectations rise, the company must achieve increasingly better results just to maintain its position. These managers might fuel the expectations treadmill for personal gain - selling deep-in-the-money options they granted themselves or making large acquisitions that boost short-term growth but dilute shareholder value in the long run. Even the best, most prudently managed compounders can fall prey to irrational investor exuberance.
At ORLY, they try to control for over-optimism and/or pessimism. While ORLY and AZO are oftentimes being called out as the next "stock splitters", we don’t see the long-term value in attracting speculators. While a stock split would boost short-term price momentum, it would lead to more volatility and lower IRRs on new periodic stock purchases.
To illustrate some of ORLY’s conservative practices, 2022 serves as a great example. A lot of volatility, a lot of buybacks for O’Reilly, and a management team that’s beaten expectations by a wide margin.
Former CEO Greg Johnson in October 2022, after ORLY had raced past the Street’s expectations and given a too conservative outlook on the remainder of the year:
As we called out, we were pleased with our third quarter performance. We're pleased with quarter-to-date through October without a doubt. The challenge we have is the unknowns and the volatility. And frankly, the challenges that we may very well experienced in the back half of the quarter.
When you look at fourth quarter, we always worry about weather, volatility you layer on the volatility in fuel prices, you layer beyond the weather just the uncertainty of the consumer and what they're going to do. And frankly, Chris, we just haven't seen an inflationary environment around the holidays in many, many years. And the holidays are always a wildcard in the fourth quarter as well. You layer on the inflation component. Those are all the reasons we're cautious in our outlook for the fourth quarter.
JP Morgan analyst Chris Horvers then asked the following question.
And then maybe, gross margin and open up LIFO a little bit which everybody loves. So basically, as you go forward, your expectation is product acquisition costs, go lower, so there should be really no -- and you've lapped through all the LIFO headwind from last year or substantially. Maybe there's a little bit left in the fourth quarter. And so, then as you go forward, if you expect lower product acquisition costs getting into '23, does that mean that you could start to see actually some gross margin tailwinds on the product acquisition side?
With the share price hitting new all-time highs and an increasing valuation multiple, CFO Fletcher tactically pushed back against too much optimism on the inflation outlook.
Yes, Chris, I don't know that we really would view it that optimistically. We're always going to work with our supplier base to ensure that we're walking a lockstep with any relief from pressure that they've seen from an input cost perspective. A lot of what we've seen so far over the course of the last year plus, has been driven by several factors, including raw materials costs, wage rates, pressures, obviously from freight that our suppliers have seen in. And we're always going to work to be sure that we're realizing appropriate reductions in rolling back cost increases where we can. But we're pretty cautious in building any expectation that that's going to be a significant helper for us as we move forward. Obviously we'll see and we'll see that play out. We do feel very confident that to whatever degree that we do see any relief on the cost side that the industry will be able to maintain those selling prices. That's certainly our intent. We'll, obviously, see how that plays out as well, but some of these cost increases are probably around the stay. - CFO Jeremy Fletcher, October 2022
It turned out that the comp growth for ORLY in Q4 2022 was the best in several years (+9.0%), with growing outperformance relative to the rest of the industry. They must have known that already in October, but why would you consciously push valuation up (thereby reducing the buyback accretion to EPS)?
The tone of conservatism is thus baked into the buybacks too. If the IRRs don’t look spectacular, ORLY’s management slows down the pace. If there’s a good opportunity, they buy back more. Not many companies implement their buybacks with the same philosophy.
Part VI - Valuation
Base Case IRR
Turning to our base valuation model.
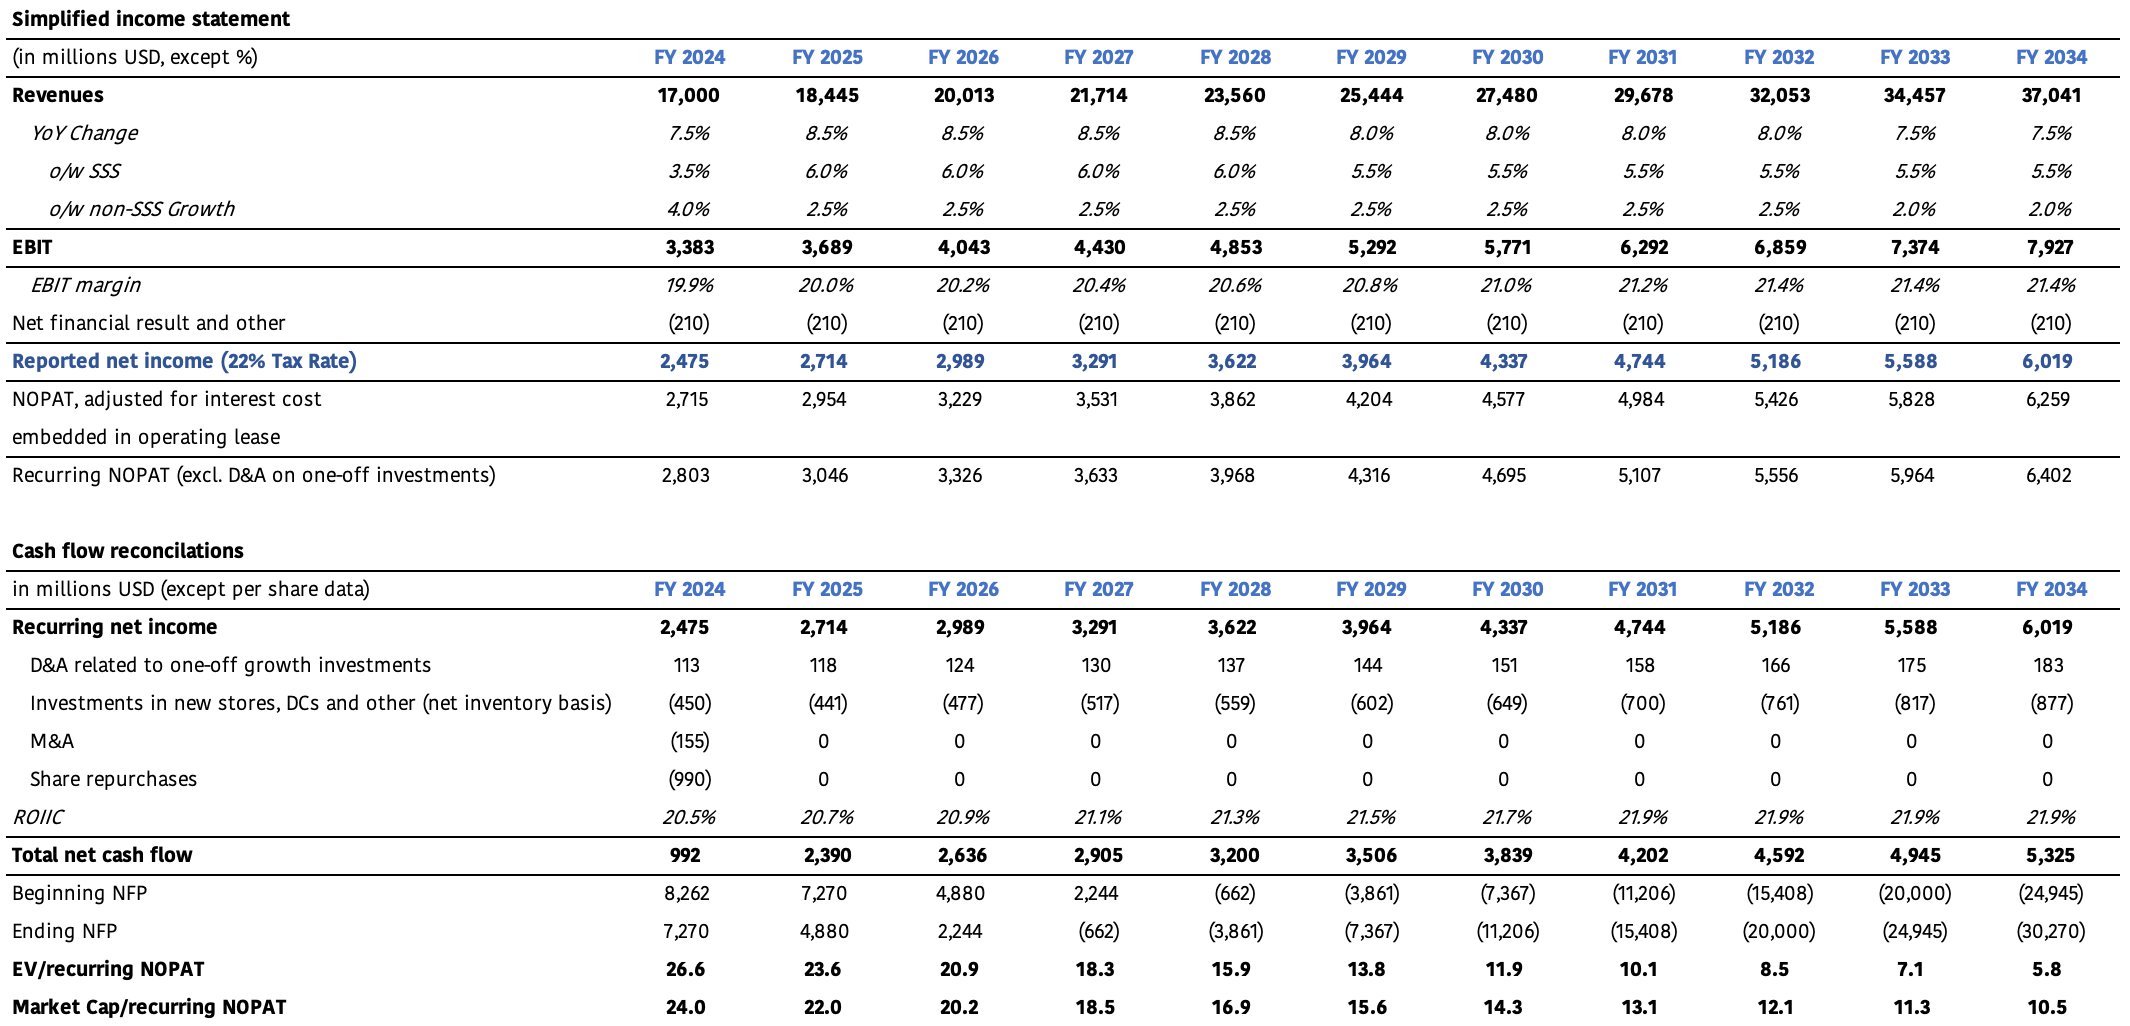
Our base case assumptions are shown in exhibit XXII. As it is impossible to factor in all optionality, we stick with our common-sense approach of ROIIC (not the reported ROIC or unusually high ROIIC over the past years), reinvestment rate, and an exit multiple that reflects the underlying business quality and growth prospects beyond the defined 10-year period.
Notes: the expected CAGR is based on a 1,138 USD entry price. A positive NFP represents net debt, a negative number is net cash. The opening/beginning NFP for FY24 is based on ORLY’s adjusted debt at the end of FY23.
Exhibit XXII - The Compounding Tortoise

As a reminder, the valuation model does not account for share repurchases as they are part of leftover FCF allocation and other than dividends, they are more volatile (so there’s no stated pay-out ratio). Furthermore, we don’t know at which multiples ORLY will repurchase stock. What we do know is that ORLY’s leverage ratio will decline if the company repurchases shares worth the remaining total FCF given its expected growth in EBITDA(R).
Let’s review our input:
Our exit multiple is set at 20x terminal NOPAT, which we view as reasonable considering ORLY’s proven strategy of delivering uninterruptedly positive comps. A 20x multiple represents a de-rating from today’s 23.8x and is based on common-sense: lower exit growth equals lower multiples. The terminal NOPAT is higher than AZO’s given ORLY’s better comparable sales growth, higher ROIIC, lower leverage, and more opportunistic use of the balance sheet to buy back stock. As with AZO, we’ve reconciled ORLY’s NOPAT to adjust for the interest cost embedded in the operating lease expense.
We expect steady margin expansion over the next decade as faster growth in DIFM (which dilutes overall profitability) is offset by ORLY’s stringent expense control and economies of scale. As such, organic ROIIC is set to improve from today’s 20.5% to 21.9%. This ROIIC reflects the company’s returns based on CAPEX and is after net inventory investments. If ORLY leases properties, we’d expect the returns to be higher. However, with leased assets, the cash expenses continue to escalate with overall inflation, whereas for one-time growth CAPEX, the straight-line depreciation is non-cash and supports the terminal NOPAT margin run-rate.
Recognizing that ORLY is going to make further expansions of its distribution centers, we’ve included these incremental investments (to support comparable sales growth at existing locations) in the total growth investment number (net of inventory). As such, the organic reinvestment rate is projected to be roughly 13-15% of total recurring NOPAT, which is adjusted for depreciation linked to previously and ongoing growth CAPEX (as discussed above).
We didn’t include potential working capital inflows from the existing base business. ORLY operates with negative working capital, which should lead to additional cash inflows when comparable sales growth is solid (as evidenced by the cash flow performance over the past few years).
The net financial expense is kept constant at 210 million USD.
We’ve factored in the already executed share repurchases over the first two quarters of FY24, net of share issuances.
We expect DIFM to grow at a high single-digit rate (comp growth) and DIY to be at low-to- mid single-digit driven primarily by same SKU inflation. As of today, ORLY has roughly 6% market share in domestic DIFM and 10% in domestic DIY. While one could debate on the total addressable market that’s readily accessible for ORLY (given its geographic footprint), we believe ORLY’s geographic expansion and structural industry drivers support the current estimate of 150 to 160 billion USD.
The IRR comes in at 9.0%, which is below our target of 11-12% before considering potential upside optionality. As always, this is just a model to provide a rough estimate of the returns today's valuation might yield. In ORLY’s case, several factors will influence its return: when will new stores fully contribute to overall profits? What will the country mix be? What’s the timing for new store and distribution center openings? How will geographic expansion unfold? Because of these variables, we view our IRR model as more of a ballpark estimate—a yardstick for making well-informed investment decisions, rather than a precise calculation.
Buyback Optionality
Talking about optionality in terms of buybacks, we’re pretty much of the view that buybacks are a tax-free bonus for shareholders; they’re not the main driver of the investment case, and in fact, they don’t create intrinsic value. They’re part of excess cash allocation (just like with dividends). Cash that’s being paid out cannot be reinvested in growth CAPEX and/or M&A.
On the surface, buybacks seem to be favorable for the total shareholder return, but after controlling for ROIC and revenue growth, the outperformance stemming from buybacks isn’t so obvious anymore.
It’s a bit like with Pareto’s law: 80% of the value creation will come from ORLY’s comparable sales growth, free cash flow performance, and steady to slightly growing profitability. The other 20% should come from proactively managing excess capital, i.e., maximizing the time value of generated cash flow.
When you’re a steady quality growth company trading at relatively stable multiples, buying back your own stock isn’t likely to be a bad allocation strategy. Consistent execution of a share repurchase program and opportunistically buying back more stock at lower valuations has proven to be a solid strategy.
Therefore, the past success of ORLY’s buybacks can be explained by the consistent cash flows, and the rational view on valuation. Markets move, and if ORLY can benefit from macro or sector driven glitches and/or overreactions to quarterly earnings (with no impact on ORLY’s long-term investment case), we’d expect more return accretion from the share repurchase program.
Part VII - Risks & Uncertainties
On the risks and uncertainties, we can think of:
lower ROIICs, especially as ORLY expands outside the US. We’ll have to see how that works out.
cash flow volatility due to poor inventory management
price war leading to lower profitability, suppressing the valuation multiple
It’s fair to say that for most of the uncertainties, ORLY (and AZO) are able to turn these into competitive strengths. The DIY segment has become increasingly consolidated, leading to ever-increasing profitability for the largest players. The DIFM side remains very fragmented and could present an opportunity to increase long-term profitability as supply is to be organized by fewer competitors.
On EVs, we believe inventory availability and ORLY’s ability to spot emerging trends will strengthen its competitive positioning. Meanwhile, the Mexican market presents a significant opportunity to keep tapping into the maintenance and failure parts for ICEs.
Part VIII - Conclusion
O'Reilly Automotive presents a compelling investment case due to its strong market position, consistent financial performance, and growth potential. The company is a leading retailer in the auto parts industry with a vast network of stores across the U.S. and Mexico, benefiting from a mix of both DIY (do-it-yourself) and DIFM (do-it-for-me) customers. O'Reilly has demonstrated consistent revenue growth, robust profit margins, and a strong track record of same-store sales growth, driven by its focus on customer service, extensive product selection, and efficient supply chain management.
The company's ability to leverage its scale for cost advantages, coupled with ongoing store expansions and market share gains, further strengthens its growth prospects. Additionally, O'Reilly's strong free cash flow generation supports shareholder returns through stock buybacks and potential dividends, making it an attractive investment for those seeking stability and growth in the retail sector.
At ORLY, there’s the culture of not taking past triumphs for granted. They remain focused on the mission statement of becoming the dominant player on both sides of the house, i.e. DIY and DIFM.
And so really for my lifetime, for our lifetime, no matter what happens in the industry, we have a lot of share we can take. We got to continue to get better. We got to continue to get better at the way we operate. We got to change, adapt to changing circumstances, but we have more opportunity than we ever have. - CEO Brad Beckham
Still, we view it as highly unlikely for ORLY to earn the high-teens to low-twenties CAGR it’s produced over the recent past and since its IPO (that is a 30-plus-year streak). At the same time, we’ve been following and owning ORLY for years now, and on many occasions, one could have said (based on a simplified valuation model): expect a 10-12% CAGR. The real-life outcome would have been >20% with a quite negligible impact from multiple expansion.
That’s quite surprising and interesting, and it can only be explained through a combination of exemplary cash management, consistent industry-leading execution throughout the cycle, and the mechanism of under-promising and over-delivering. As such, our thesis for our “cannibal tandem” (i.e. AZO and ORLY) to produce solid risk-adjusted and absolute returns remains intact.
While the current valuation incl. value-accretive buyback optionality would imply a 11-12ish percent IRR, we steadfastly believe this return can and will be improved by taking advantage of broad-based market dips, sector-specific corrections (e.g. Advance Auto reporting weak quarterly results), or short-term glitches related to missing the Street’s estimates on quarterly earnings. As such, having a decent "toehold" position and then adding along the way is likely to be the way to go for long-term quality growth investors.
This is a good summary. @CT: Do you have a more deep dive explanation to your Valuation Model (Exhibit XXII)? Or a sample / short description to understand the last part for the simplified valuation? Thanks for this!