
The Complexity of Past Performance in Valuing Stocks
Appreciating the consequences of a changing capital allocation mix and ROIIC

Over the past week, we’ve received quite a bit of questions on Pool Corporation. Referring to some screeners’ info (which we’re not incorporating into our own analysis process, as you know), it’s got a return on capital of 23% in FY24 (used to be 30% in FY18), the company’s buying back its own stock, the dividend’s grown at a nice clip, and it’s trading at a low valuation compared to the recent past. Why wouldn’t this work from here (over the next years), given where the stock’s trading?
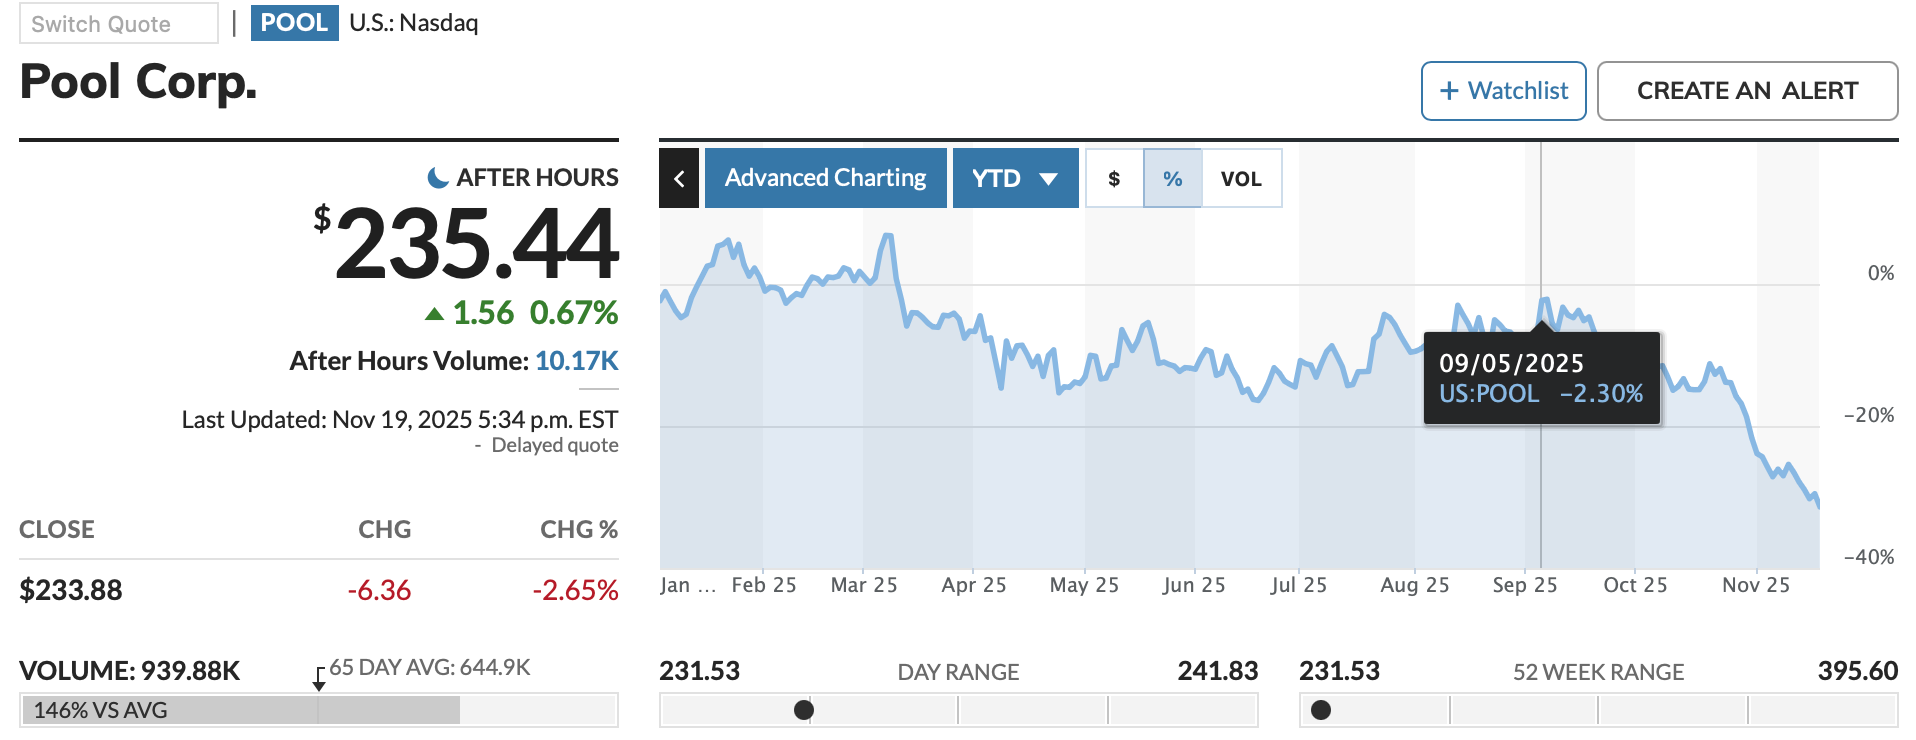
I had already prepared some key notes as to why I’ve been very reluctant to buying this name (and still continue to hold off). So, I decided why not just put this content out in a video update during the week instead of the weekend.
Pool Corporation is a perfect example of why a company’s capital allocation mix and implied returns on capital can’t be kept constant. Embracing this reality, and breaking down every component of capital deployment and how management thinks about it is key to understanding valuation and the range of forward returns. To us, that’s what makes investing and entrepreneurship so intriguing: it’s an intellectual game that’s not black or white.
Now, there are exceptions to this - companies whose returns have been very stable, when adjusting for specific items such as leasing and inflation. A good example would be Hermès: very steady returns on incremental invested capital over time, unsurprisingly given the controlled growth model. At Ferrari, the returns have only improved as the company’s leveraged previous cycles’ investments in its various powertrains.
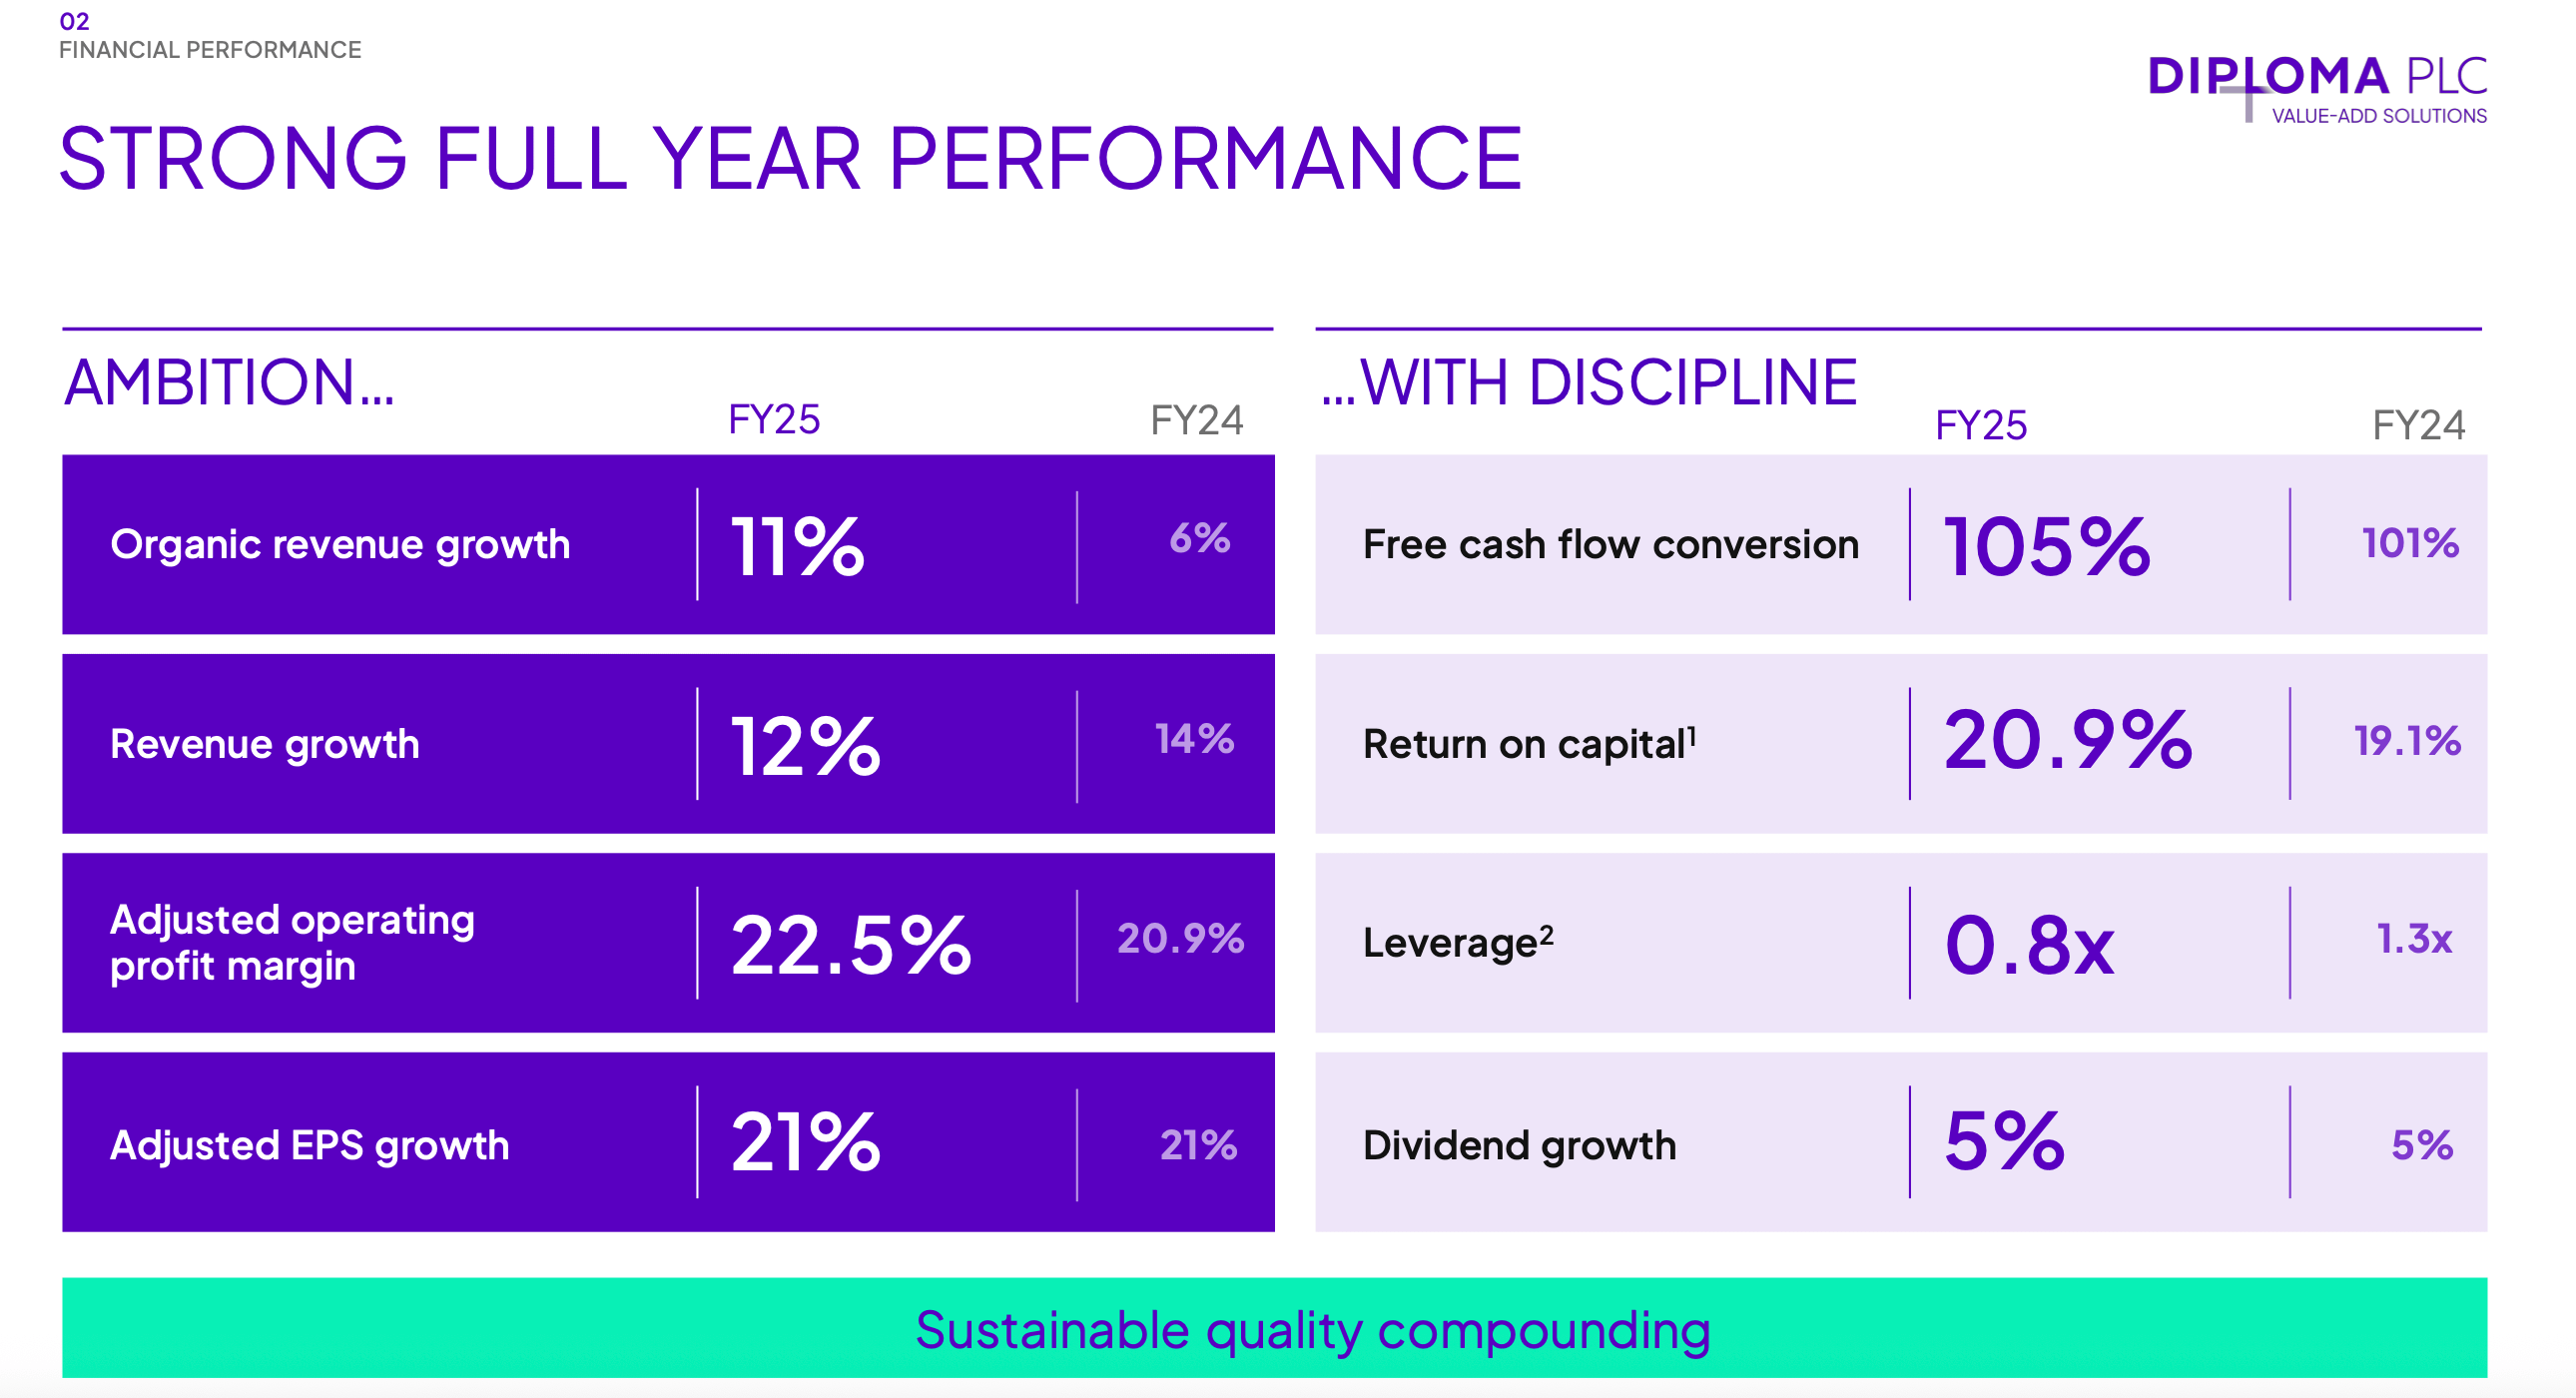
There are also situations where you’re blown away by the exceptionally solid return on an investment, making it easy for investors to extrapolate such strong performance well into the future. Last June, we did a deep dive on Diploma.

It’s been a great serial acquirer that managed to get its hands on Peerless, a quality growth company servicing the aerospace industry. We’ve never seen such high un-levered IRR for a deal this large (300m USD): now running at >27% (on a 15-year basis). Now, as the CEO said last year, not every acquisition comes flying out of the traps. And so, serial acquirers are oftentimes faced with so-called ROIIC/IRR dispersion. There’s a lot to learn from past analyses to refine our thought process, so we’re revisiting our deep dive in today’s video update.
Secondly, for newer subscribers, we share the elevator pitch on why we added to three positions yesterday. For two of these companies, there was some recent news related to competition and the overall state of consumer spending on discretionary categories. Essentially, they back up our view why we own them (and will keep buying more), and our preference for looking beyond the next 3-12 month horizon that analysts are very focused on.
We particularly like these attributes:
tangible and slow-moving businesses with high ROIICs;
high IRRs on growth investments (i.e., it doesn’t take ages to grow profits nicely, and in turn, generate new cash flow out of these reinvestments);
a clear operating growth model, and;
plenty of excess free cash flow over the next decade that will accrue to shareholders or be put to work at accretive returns. Combined, these factors back up a >12% IRR for shareholders.
We talked about the underpriced value of excess cash flow last week.

You can download the slide deck and transcript below.
As ever, an overview of our long-only equity portfolio allocations and the implied CAGR for each position can be found on the Portfolio page. We update the specific CAGR from time to time; the CAGR ranges are updated every quarter (next update planned for the second week of December).