Our Portfolio & Valuation Methodology
>12% Annualized Return
What do we expect from our portfolio? Time is the friend of a great business that can compound its invested capital at a fast clip, whilst keeping financial risks low. Still, we should always monitor changes in their capital allocation strategy.
The key question is whether our quality growth companies will experience mean reversion, and if so, on which metrics? In other words, how will changes in these variables ultimately impact their valuation? It’s too easy to state that company X with a 25% ROIIC, 35% reported ROIC and industry-leading margins and revenue growth will mean-revert, and hence, it should be trading at market-average multiples.
Our goal is to achieve a 12% CAGR over a longer timeframe, and this applies to all purchases. Naturally, during market drawdowns, opportunities arise to add to positions, making it easier to achieve that 12% target since volatility often creates opportunities. We observed this dynamic in 2022, during the VIX spike last August, and in April 2025. It’s not just about returns, though, it’s also about thinking in scenarios, thinking about optionality, capital allocation, management teams falling victim to market sentiment etc.
Rolling Return
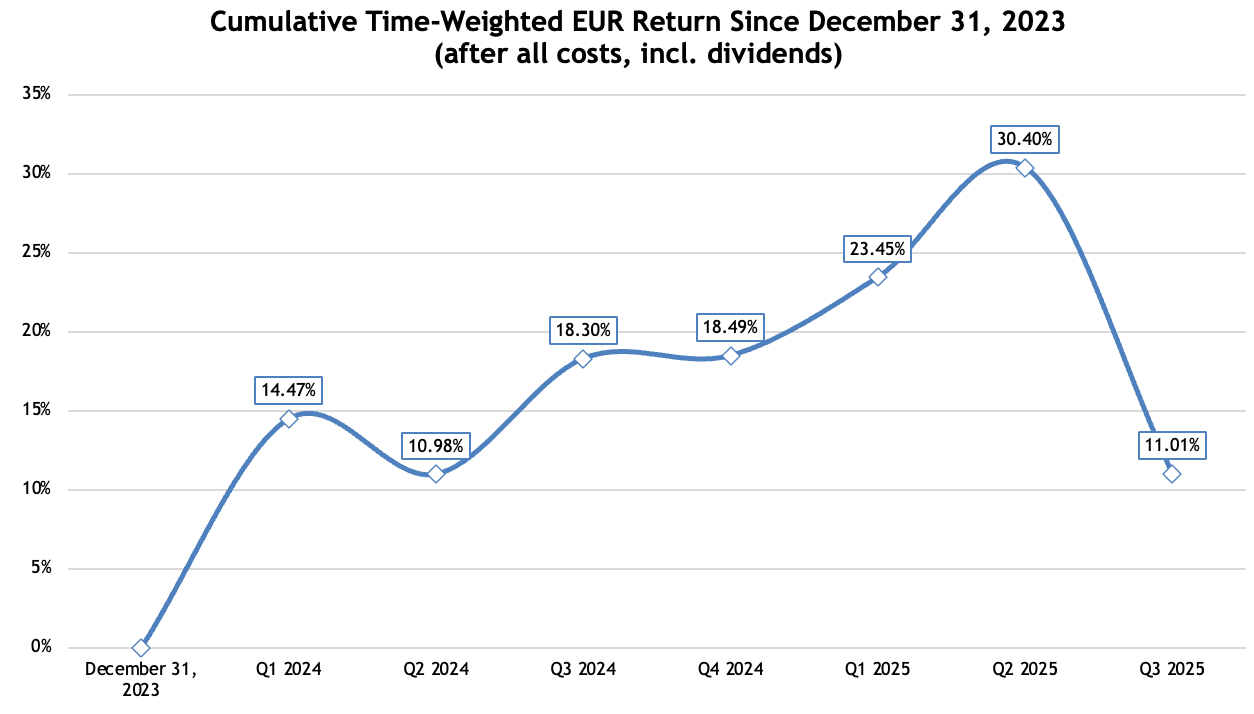
Below you can see our live fully-invested time-weighted portfolio return incl. dividends, and after transaction costs (in EUR) since December 31, 2023.
This time-weighted return is a trustworthy metric versus a money-weighted approach where buying the dip could distort near- and mid-term performance. The time-weighted metric makes comparing to other investments fair.
We don’t intend to compare ourselves to an index over a short period of time (<5 years).
Country & Sector Mix (November 18, 2025)
Portfolio Allocations
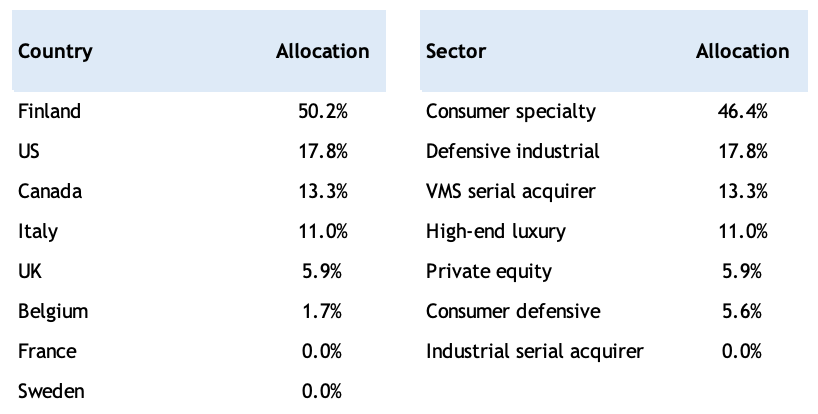
Here is our live portfolio as of November 18, 2025 in terms of allocation. It reflects our real individual stock weightings in our public stock investment portfolio.
Our goal is to show the performance excluding the effects of our personal cash additions or withdrawals. The returns reflect those of a fully invested high-quality stock portfolio. The returns are not money-weighted and thus our personal cash injections won’t interfere with our shared performance metrics during stock market corrections or rallies. We present a transparent portfolio that’s easy to follow.


